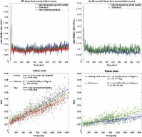
1 Introduction Multiple sclerosis (MS) is primarily an immune-mediated disease of the central nervous system in which auto-aggressive T-cells are thought to cross the blood–brain barrier (BBB) inflicting demyelination and axonal loss eventually leading to progressive disability. A key event in MS is the formation of acute gadolinium-enhancing lesions, resulting from an overt breach of the BBB (Runge et al., 1985). In spite of intensive research, the etiology of MS is largely unknown, but recent developments in MS drug therapies have emphasized leukocyte passage across the BBB as being of paramount importance for disease pathophysiology. Histopathological studies have reported abnormalities of the BBB in inactive MS lesions as well as normal appearing white matter (NAWM) (Kirk et al., 2003; McQuaid et al., 2009; Plumb et al., 2002; Vos et al., 2005), and serial MRI studies have indicated that structural changes (Filippi et al., 1998; Werring, 2000) and BBB dysfunction (Goodkin et al., 1998) may precede myelin damage and leukocyte infiltration. On the other hand, activated leukocytes themselves are capable of altering BBB permeability through expression and secretion of inflammatory cytokines (Larochelle et al., 2011). Hence, the sequence of events is not entirely clear. Recent efforts have been made to use MRI to compare permeability of the BBB in the NAWM of MS patients to corresponding white matter in healthy controls using changes in T1 after gadolinium administration, but so far, studies have been inconclusive (Lund et al., 2013; Silver et al., 2001). Ingrisch and colleagues successfully used dynamic contrast enhanced (DCE) MRI, a method which is potentially more sensitive when attempting to measure subtle changes in BBB permeability, and reported a Ktrans of 0.04 mL/100 g/min in MS NAWM, but included no healthy controls for comparison (Ingrisch et al., 2012). Hence, the primary aim of this study was to use quantitative dynamic contrast enhanced (DCE) MRI to investigate whether permeability of the BBB is increased in MS normal appearing brain tissue compared to healthy tissue in controls. In MS patients we also wanted to investigate any correlations between permeability in MS lesions and normal appearing tissue and clinical characteristics, such as treatment status, disability, recent relapse activity and presence of contrast-enhancing lesions. 2 Materials and methods 2.1 MS patients and healthy volunteers We enrolled 27 RRMS patients (Table 1) from the MS clinic at Glostrup Hospital, all referred to MRI as part of an evaluation prior to initiation of second-line MS treatment, e.g. natalizumab or fingolimod, due to a high degree of disease activity and/or side-effects on current or previous treatment. 18 patients were undergoing immunomodulatory treatment at time of investigation (Table 1). Patient clinical data was obtained from hospital clinical records and included expanded disability status scale (EDSS), MS disease duration, current treatment status, and history of clinical relapses 12 months prior to investigation. This procedure was performed blinded to the permeability values. Relapse was defined as new or worsening symptoms that lasted 24 h and occurred in the absence of fever or infection (Schumacher et al., 1965). An experienced physician, blinded to the permeability values, performed the procedure of going through the clinical records. Patients were excluded from this study if they had been treated with corticosteroids within the last 30 days. We included 24 matched healthy controls, who did not have any first-degree relatives with MS, and have any inflammatory diseases or frequent migraine attacks (> 1/month). MS patients and healthy controls were scanned in an interleaved fashion in order to minimize the impact of slight scanner hardware differences (i.e. scanner drift) over time on the results. 2.2 Ethics This study was approved by the Ethics Committee of Copenhagen County according to the standards of the National Committee on Health Research Ethics, protocol number H-D-2008-002. All experiments were conducted in accordance with the Helsinki Declaration of 1975 and all subjects gave written informed consent. 2.3 Dynamic contrast enhanced (DCE) MRI MRI was performed on a 3T MR unit (Philips Achieva) using a 32-element phased-array head coil. DCE imaging used a T1-weighted saturation-recovery gradient-echo sequence with flip angle 30°, TR = 3.9 ms, TE = 1.9 ms, centric phase ordering, parallel imaging factor 2, acquired matrix 96 × 61, field-of-view 230 × 182 mm2, 5 slices, slice thickness 8 mm. Data for an initial measurement of relaxation time (T1) and equilibrium magnetization (M0) was generated using a series of saturation time delays (TDs) from 120 ms to 10 s, covering the same slices as imaged during the bolus passage. The dynamic sequence used a saturation time delay (TD) of 120 ms, giving a time resolution of 1.25 s, and 750 time points, corresponding to a total sampling duration of 15.7 min. The automatic bolus injection (Spectris, Medrad; USA) with speed 3–5 mL/s followed by 20 mL saline was started after the 10th time point. Injection duration was approximately 1 s. The dose of contrast agent (Gadovist) was 0.045 mmol/kg bodyweight. We acquired a separate slice at the level of the internal carotid artery (ICA) to obtain an arterial input function with minimal partial volume. The remaining four DCE slices were used for defining regions of interest and subsequent tissue perfusion estimation. In order to evaluate the scanner drift on our system over time we performed a series of sham perfusion measurements (same DCE sequence without contrast agent) and found a linear signal increase over 15 min in the order of 1–3%. 2.4 MRI sequences and regions of interest We used an axial T2-weighted MRI sequence (5 slices, TE = 100 ms, TR = 3000 ms, field-of-view = 230 × 119 mm2) with same orientation and slice thickness (8 mm) as our DCE sequence, in order to manually draw regions of interest (ROIs) in the periventricular NAWM, the normal appearing gray matter (NAGM) and in thalamic gray matter in both hemispheres (Fig. 1). We manually defined periventricular normal appearing white matter by visual inspection performed by an experienced MS investigator, and we took care not to include any visible T2-lesions or areas visibly presenting themselves as diffusely abnormal on a T2 image. For this procedure we used an axial T2 FLAIR sequence (35 slices, TE = 125 ms, TR = 11,000 ms, field-of-view = 230 × 119 mm2, slice thickness of 3.5 mm) to check that no lesions were present in the ROIs. For the healthy controls, we strived to match the anatomical location and size of the ROIs as close as possible (see Table 1). Periventricular NAWM was placed at a minimum of 10 mm from any MS lesions. In MS patients with visible contrast-enhancing lesions we took care not to include the nearest 30 mm of non-enhancing tissue into the periventricular NAWM. Due to lack of the appropriate MRI sequence, we were not able to absolutely exclude gray matter lesions from our NAGM ROIs. MS lesions were defined as a T2 hyperintense lesion, > 3 mm in size with a typical anatomical location for MS, i.e. periventricular, juxtacortical or infratentorial. An experienced MS investigator performed this procedure manually. The distinction between non-enhancing lesions (NELs) and contrast-enhancing lesions (CELs) was made by visual inspection using a post gadolinium T1-weight sequence. Our four perfusion slices were placed in order to include the largest number of MS lesions possible. Out of these lesions, we only included those large enough to fill the 8 mm DCE slices for further analysis, in order to minimize partial volume effects. Out of a grand total of 498 visibly non-enhancing lesions identified on T2 and T2 FLAIR images we were able to estimate permeability in 274 visibly non-enhancing lesions (mean number of lesions per patient 12.4; SD 8.9). All MS patients had non-enhancing lesions, and five patients showed one or more contrast enhancing lesions on a post contrast T1 weighted image. 2.5 Permeability estimation The DCE MRI data was analyzed with a semi-automatic procedure (Larsson et al., 2008) using in-house MatLab-based software. The DCE time series was converted to units of contrast agent concentration using T1 and M0, as determined from the multiple saturation delay data, and a contrast agent relaxivity of 4 s− 1 mM− 1. The input function was measured in the voxel in the ICA with maximal signal change during the bolus passage and corrected for partial volume by normalizing to a phase derived venous outflow function, free of any partial volume effects (van Osch et al., 2001), sampled in the sagittal sinus (Hansen et al., 2009). For each ROI the median value of permeability was extracted to exclude effects of possible outliers. Every subject was represented by one value calculated as a mean of the tissue specific ROIs (Fig. 1). Tissue concentration–time curves were evaluated using a combination of model free deconvolution and a Patlak model, as described in previous work (Larsson et al., 2009). Example tissue enhancement curves and Patlak plots from one MS patient and one healthy control can be seen in Fig. 2. Permeability values, Ktrans were calculated from Ki (full blood) using the formula Ki = Ktrans / (1 − Hct). A fixed value of Hct = 0.45 was used throughout the study. Values of Ktrans are reported as mL/100 g/min assuming brain tissue density of 1 g/mL. 2.6 Statistics Histograms, probability plots and modified Kolmogorov–Smirnov (Lilliefors) testing were used to analyze for standard normal distribution fit. Since we hypothesized that permeability would be higher in MS patients, we used a one-tailed T test for statistical comparisons between patients and healthy controls, and a p-value lower than 0.05 to allow us to reject the null hypothesis. For comparisons between subgroups of patients we used two-tailed T tests. We used a standard linear regression approach to analyze for correlations with subject demographics and MS clinical parameters. 3 Results In periventricular NAWM we found significantly higher values of BBB permeability in MS patients in comparison to cerebral white matter of healthy controls (p = 0.9 × 10− 5; one-tailed T test) (Fig. 3). In thalamic gray matter we also found significantly higher values in MS patients when compared to healthy controls (p = 0.003; one-tailed T test). In NAGM no significant difference was found (Table 1). 3.1 Clinical relapses and treatment status In MS patients with one or more clinical relapses within the last three months (n = 10) we found significantly higher permeability in periventricular NAWM (p = 0.004), thalamic gray matter (p = 0.004), and non-enhancing lesions (NELs) (p = 0.003; two-tailed T tests), compared to patients with no relapses within the last three months (n = 17) (Fig. 4). A linear regression analysis, modeling the combined effect of treatment and recent relapse, showed that treatment (Beta = − 0.021 mL/100 g/min, p = 0.039) and relapse within the last three months (Beta = 0.034 mL/100 g/min, p = 0.001) were significant predictors of permeability in MS NEL. The overall model fit was R2 = 0.37 and p = 0.001 with no significant interaction between the two parameters. In periventricular NAWM we saw the same trend with treatment (Beta = − 0.011 mL/100 g/min, p = 0.42) and relapse within the last three months (Beta = 0.041 mL/100 g/min, p = 0.004), with significant model fit of R2 = 0.31 and p = 0.01. Relapse within the last six months (n = 17), relapse at time of investigation (n = 3), total number of relapses within one year, and presence of one or more contrast-enhancing lesions (CELs) (5 patients) could not predict permeability in periventricular NAWM or NEL. In a post-hoc analysis we wanted to investigate a possible effect of immunomodulatory treatment on permeability after an MS relapse. Regression analysis showed that in MS patients receiving treatment, a logarithmic function best explained the relation between number of days since onset of last relapse and permeability in NEL (R2 = 0.42, beta = − 0.052, p = 0.004) and periventricular NAWM (R2 = 0.30, beta = − 0.028, p = 0.019) (Fig. 5). In other words, for every 100% increase in days since onset of last MS relapse, the permeability decreased by 0.052 mL/100 g/min in NEL and 0.028 mL/100 g/min in periventricular NAWM. In the no treatment group we did not find such a correlation. To investigate whether the MS patients with no relapse within 3 months (n = 17) showed higher permeability than healthy controls, we compared periventricular NAWM to the cerebral white matter of healthy controls and still found significantly higher permeability values (p = 0.00011; one-sided T test). Comparing mean permeability in MS NELs (n = 274) to the periventricular NAWM, we found no significant difference (paired T test). A subgroup analysis comparing isointense and hypointense (black holes) lesions as seen on T1 weighted MRI did not show any significant differences in permeability (data not shown). 4 Discussion In this study we report the novel finding of significantly increased permeability of the BBB in MS periventricular NAWM compared to healthy white matter of controls. A recent study using a similar MRI method to investigate only MS patients, reported a mean Ktrans of 0.04 (SD 0.03) mL/100 mL/min in periventricular NAWM (Ingrisch et al., 2012). In our study we find slightly higher values, which could be due to methodological differences, e.g. shorter total sampling time of 7 min, usage of a two compartment model with more parameters to fit, and also differences in the study cohorts. Firstly, we did not include secondary progressive MS patients, where the relationship between inflammation and damage to the BBB is less obvious than in RRMS (Lassmann et al., 2012), secondly, our cohorts were all evaluated for treatment intensification, thus presumably having a high relative disease activity (10 patients had one or more relapses within the last three months). In healthy controls, the finding of low grade leakage seems in good agreement with the previously estimated PET value of 0.03 mL/100 g/min (SD 0.008) (Ki = 0.0003 min− 1) reported by Iannotti et al. (1987). Although previous studies using ∆R1 / ∆t after gadolinium administration to compare leakage in MS NAWM and white matter in healthy controls have not found significant differences, they report a non-significant trend for elevated signal (Silver et al., 2001) and a higher coefficient of variation (Lund et al., 2013) in NAWM in MS patients. First of all, both studies included a relatively low number of healthy controls (Silver, n = 5; Lund, n = 9) and secondly, all patients in the study by Lund and colleagues received immunomodulatory treatment. Lastly, scanner instability due to changes in hardware, etc. may blur results if patients and controls are scanned at different time periods. All these factors may have contributed to not finding a significant difference. In MS patients we observe higher permeability in periventricular NAWM compared to thalamic gray matter and NAGM. This distribution conforms well with the established knowledge of anatomical predilection areas of MS lesions which are often located near the ventricles, less commonly occurring in the cortical NAGM and even rarer in the thalamus. It must be noted, however, that in NAGM we were not able to visualize and exclude gray matter MS lesions. Hence, some lesions might have been included in the NAGM, blurring the picture. In visibly non-enhancing lesions we find similar permeability when compared to periventricular NAWM, a finding which is supported by Ingrisch and colleagues, using DCE with a total sampling time of 7 min (Ingrisch et al., 2012). One earlier study by Soon and colleagues did however report a higher degree of leakage in inactive MS lesions when compared to contralateral NAWM (Soon et al., 2007). This leakage was primarily observed to occur 20 and 40 min post-contrast, and previous work suggests that low permeating MS lesions may not reach maximum concentration of contrast agent until 2 h after injection (Tofts, 1995). We have no good explanation for these discrepancies in results, and whether ∆R1 / ∆t after contrast injection or DCE is more sensitive for measuring very subtle changes in BBB permeability is currently not known. 4.1 Relapse activity We found relapse within the last three months to be a significant predictor of permeability in periventricular NAWM, thalamus and NEL. We are aware of two MRI studies describing a similar phenomenon with structural abnormalities occurring consecutively in MS lesions and in contralateral NAWM (De Stefano, 1999; Werring, 2000). In both cases the authors suggested cross-hemispherical Wallerian degeneration to explain this finding. The widespread and fluctuating nature of relapse related permeability changes that we observe in our data might be more suggestive of inflammatory processes causing this. Hence, an MS relapse, despite being a somewhat heterogeneous clinical entity presenting itself with focal neurological symptoms, may just be the “tip of the iceberg” of more widespread BBB changes with demyelinating lesions occurring when BBB permeability exceeds a certain threshold. In our data, permeability in NAWM or NEL was not predicted by presence of CELs (5 patients). Two of these patients had only one small (< 3 mm) CEL each, and no history of recent clinical relapse activity. This seems to fit well with previous works, which have shown poor correlation between CELs and clinical symptoms (Harris et al., 1991; Kermode et al., 1990). An important limitation is of course that only five patients had one or more CEL, thus yielding low statistical power. 4.2 Immunomodulatory treatment Treatment coincided with significantly lower permeability in NEL in MS patients having had no relapse within the last three months. This could be a direct effect of treatment that “normalizes” the BBB to a more impermeable state during stable disease periods. In the treated MS patients a logarithmic function best explained the relation between permeability in MS NEL and periventricular NAWM and the number of days since onset of last relapse. In other words, shortly after a relapse when the permeability is high, immunomodulatory treatment may act to speed up the rate of closing of the BBB, ending up at a level that is comparable to healthy controls (Fig. 5). Given that the total number of relapses within the last year could not predict permeability, it appears that this is indeed a time effect and not just related to overall higher relapse activity. At least in the case of IFN-beta-1a, it has been shown to stabilize barrier characteristics of human brain capillary endothelial cells in vitro (Kraus et al., 2008). This would serve to explain why some studies find no difference between healthy controls and MS patients undergoing immunomodulatory treatment (Lund et al., 2013) or having no recent relapses (Silver et al., 2001). Further study of the temporal evolution of permeability before, during and after occurrence of an MS relapse in treated and untreated MS patients is needed to shed further light on this matter. 4.3 Disruption of the blood–brain barrier in MS The idea of a disrupted BBB as a prerequisite for developing MS is not new. According to one major theory, put forward by Poser in 1986, four elements are required in order to develop MS: 1) genetic susceptibility, 2) an environmental and probably viral immune-mediated event, 3) alteration of the BBB function and 4) myelinoclastic plaque-forming capability in the CNS (Poser, 1986). Our results indicate that such a BBB disruption is present in MS on a widespread level in the CNS being more pronounced in areas prone to development of MS lesions. Even patients without a relapse within the last 3 months show higher permeability compared to control, leading us to speculate as to whether an underlying pathology of the BBB could be present in MS. However, the MS disease process itself seems capable of modifying the permeability of the BBB (Larochelle et al., 2011; Minagar and Alexander, 2003) but we observed no correlation between permeability and age, EDSS or years since MS onset indicating that BBB abnormalities do not seem to worsen with disease progression. This question could be addressed further by investigating a large cohort of treatment naive patients with clinically isolated syndrome or early MS. The large body of evidence supporting BBB dysfunction in MS is reviewed in detail elsewhere (Poser, 1986, 1992, 2004) with two main points. First, both MS patients and many healthy individuals have autoreactive T cells against self-antigens such as myelin-basic-protein (MBP) circulating in the blood (Elong Ngono et al., 2012), arguing that a barrier defect is needed to develop the disease. Second, no single triggering event or pathogen has been found so far that can trigger MS or cause relapses in patients with existing MS (Owens and Bennett, 2012). On the contrary, evidence indicates that infection with many different pathogens, either bacterial or viral, increases the risk of relapse up to twofold, gives more severe relapses and shows increased lesion activity on MRI (Correale et al., 2006). Even trauma and certain chemical effects seem to be able to initiate the plaque forming process in some MS cases (Poser, 1994). If a weak barrier function is present in MS this could lead to higher sensitivity to various irritants, initiating a subsequent immune response. Recent works even suggest that Epstein–Barr virus, which has long been linked to MS (Owens and Bennett, 2012; Pakpoor et al., 2013), is capable of infecting the human endothelial cells of the BBB (Casiraghi et al., 2011). The authors propose a model of reactivation of latent EBV, which leads to an increased production of pro-inflammatory mediators and immune cell adherence inducing a breach in the BBB. In an individual with an increased level of peripheral autoreactive T cells, this could lead to an initial localized entry of immune cells and the development of CNS lesions. Only a minority of cells need be infected and express viral genes, which would serve to explain the inconsistent detection of EBV in MS brains (Willis et al., 2009) and CSF (Mancuso et al., 2010). Hence, we raise the question as to whether dysfunction or dysmaturation of the BBB could make certain predisposed individuals more prone to later development of MS. 5 Conclusion Our results emphasize the importance of BBB pathology in MS, which we find to be most prominent in the periventricular NAWM, an area prone to development of new MS lesions. Given that recent relapse coincides with higher permeability in NEL, periventricular NAWM and thalamic gray matter, and that permeability in NEL is lower in patients undergoing immunomodulatory treatment, it appears that BBB permeability depends upon the current level of generalized MS inflammatory activity. Our method holds promise of being a non-invasive tool for monitoring relapse activity and/or treatment effect. Furthermore, it could be used to investigate whether an underlying pathology of the BBB is present in MS if applied on a larger group of treatment naive patients with clinically isolated syndrome or early MS. Conflict of interest statement The authors declare that there are no conflicts of interest. Funding This work was supported by the Research Foundation of the Capital Region of Denmark, Foundation for Health Research [grant number R129-A4197]; Biogen Idec [grant number GLO-01-2012]; and the Danish Multiple Sclerosis Society [grant number 14588].