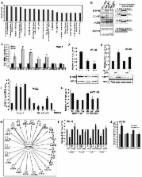
Introduction The eukaryotic genome harbors a large number of noncoding RNAs, which include small and long noncoding RNAs (lncRNAs) [1], [2], [3], [4]. Small ncRNAs such as microRNAs regulate the expression of target genes at the level of translation or mRNA stability, whereas piwi-interacting RNAs (piRNA) have been linked to transcriptional gene silencing of retrotransposons and other repeat-containing genetic elements [5], [6], [7], [8]. In addition to the class of well-studied small ncRNAs, lncRNAs, which are noncoding transcripts that are >200 nucleotides in length, have recently emerged as important molecules in several cellular processes [4], [9], [10]. The human genome encodes ∼15,000–17,000 potential lncRNAs. However, the function of less than 2% of the human lncRNAs is clearly elucidated [11], [12]. LncRNAs are involved in several crucial functions: they can act as a scaffold to keep several proteins tethered to a specific cellular compartment, act as a guide to recruit proteins to a specific chromatin site or influence local chromatin architecture [3], [4], [13], [14], [15]. For instance, the X-chromosome encoded Xist lncRNA coats the inactive X-chromosome (Xi) in female mammals and facilitates the recruitment of chromatin modifiers to the Xi [16], [17]. Similarly, the imprinted Air lncRNA interacts with the histone-methyl transferase G9a and recruits it to epigenetically silence Slc22a3 [18], [19], [20]. Further, nuclear-retained lncRNAs act as structural components of specific sub-nuclear domains [21], [22], [23], [24]. LncRNAs are also known to regulate transcription and RNA processing events and also serve as precursors for small RNAs [14], [15]. Several lncRNAs exhibit temporal and spatial expression patterns or their expression is restricted to particular tissue or cell types or cell cycle stages, indicating vital and diverse biological roles of lncRNAs [4], [25], [26], [27], [28]. A recent study demonstrated cell cycle-regulated expression of several of the lncRNAs in mammalian cells [29]. The authors identified >200 lncRNAs encoded in close proximity to more than 50 protein-coding genes involved in cell cycle, including cyclins and cyclin-dependent kinases. During cell cycle progression, the levels of both lncRNAs and the nearby cell cycle gene mRNAs displayed dynamic fluctuations. However, the expression of these lncRNAs did not correlate either positively or negatively with the expression of the nearby cell cycle genes [29]. This implies that although some lncRNAs and mRNAs could be regulated in concert, they may not necessarily regulate each other. On the other hand, several other studies have demonstrated the involvement of lncRNAs in regulating the expression of cell cycle genes in cis [30], [31], [32], [33]. The ANRIL lncRNA is located upstream of the tumor suppressor locus encoding p16INK4A and p15INK4B , mutations or depletion of ANRIL results in the loss of p16INK4A and p15INK4B repression [30], [31], [32]. Similarly, an lncRNA transcribed from the 5′regulatory region of Cyclin D1 (CCND1) recruits TLS, an RNA-binding protein, to the CCND1 gene in response to DNA damage, and results in the transcription repression of CCND1 [33]. A large number of lncRNAs display deregulated expression in human cancer samples and are regulated by oncogenic or tumor suppressor pathways [28], [34], [35], [36], [37], [38]. The HOTAIR lncRNA, which is known to regulate the expression of HOX gene clusters, is highly induced in breast cancer samples and its elevated expression has been correlated with metastasis and death [39]. Recent studies have also demonstrated the involvement of lncRNAs in the p53 gene regulatory pathway [4]. For example, lincRNA-p21 is activated by p53 and serves as a repressor in the p53-dependent transcriptional network [40]. DNA damage induces the expression of another lncRNA, PANDA in a p53-dependent manner. PANDA is transcribed from the p21 (CDKN1A) promoter, and it negatively regulates the expression of pro-apoptotic genes upon DNA damage, thereby controlling apoptosis [29]. Finally MEG3, an imprinted lncRNA induces accumulation of p53 by negatively regulating MDM2 expression [41]. The lncRNA MALAT1 is upregulated in several solid tumors and its differential expression is linked with cancer metastasis and recurrence [15], [28], [42]. MALAT1 is a highly abundant nucleus-restricted RNA that localizes to nuclear speckles, a sub-nuclear domain suggested to coordinate RNA polymerase II transcription, pre-mRNA splicing and mRNA export [43], [44], [45]. MALAT1 interacts with several pre-mRNA splicing factors including serine arginine dipeptide-containing SR family splicing factors [46], [47], [48], [49], [50], [51]. Furthermore, MALAT1 modulates the cellular distribution and activity of SR splicing factors thereby influencing alternative splicing of pre-mRNAs [50]. By utilizing such a mechanism, cells could alter the local concentration of a particular splicing factor upon a specific external signal or during specific stages of the cell cycle. Previous studies have shown that transient overexpression of MALAT1 enhanced cellular proliferation in cell lines and tumor formation in nude mice, while depletion of MALAT1 in tumor cells reduced tumorigenicity [52], [53]. A recent study suggested the involvement of MALAT1 in regulating the E2F1 transcription factor activity, which is a crucial determinant of cell cycle progression and tumorigenesis [54]. These results indicate that MALAT1 has a pro-proliferative function; however, the mechanism has yet to be identified. In the present study, we examined the role of MALAT1 in cell cycle progression. We demonstrate that in human cells, MALAT1 levels are regulated during the cell division cycle. The differential levels of MALAT1 during specific cell cycle stages influence the expression of genes involved in cell cycle progression. Furthermore, MALAT1 depletion in normal human diploid fibroblasts (HDFs) induces DNA-damage response and results in the activation of p53 and its target genes. The cell cycle defects observed in MALAT1-depleted cells are sensitive to the cellular levels of p53, indicating that p53 is an important effector of MALAT1 function. Finally, we establish that the pro-proliferative role of MALAT1 is accomplished by its involvement in regulating the expression and/or pre-mRNA processing of oncogenic transcription factors, especially those that control mitotic progression. Results MALAT1 controls cell cycle progression in human cells In order to understand the role of MALAT1 in cellular proliferation, we synchronized human osteosarcoma cells (U2OS) in specific cell cycle stages (Figure 1A) and examined the levels of MALAT1 in each stage of the cell cycle. Quantitative RT-PCR (qRT-PCR) results revealed cell cycle-dependent expression of MALAT1, with low levels during G1 and G2 and high levels during G1/S and mitosis (M) (Figure 1A). Similar cell cycle regulation of MALAT1 was also observed in WI-38 human diploid lung fibroblasts (HDFs; Figure S1A). We have previously proposed that MALAT1 modulates pre-mRNA splicing by titrating the cellular levels of SR splicing factors [15], [50]. This prompted us to also examine the levels of SR proteins during various phases of cell cycle. SRSF1 levels remained unaltered during cell cycle (Figure S1B), indicating that the changes in MALAT1 levels during the cell cycle could fine tune the association of SR proteins with pre-mRNAs and thereby modulate cell cycle-specific alternative splicing. 10.1371/journal.pgen.1003368.g001 Figure 1 MALAT1 levels are cell cycle regulated and depletion of MALAT1 results in proliferation defect. (A) Flow cytometry and qRT-PCR analyses on cell cycle-synchronized U2OS cells. (B) BrdU-PI flow cytometry analyses in control (scr-oligo) and MALAT1-depleted (MALAT1-AS1 & -AS2) human diploid lung fibroblasts (WI-38). (C) BrdU pulse-labeling (red) and lamin A/C immunostaining (green) in control and MALAT1-depleted WI-38 cells. The number designates the percentage of BrdU-incorporating cells. (D) Proliferation assay shows reduced proliferation in MALAT1-depleted WI-38 cells. (E–F) The expression of indicated genes is determined by qRT-PCR and immunoblot assays from control and MALAT1-depleted WI-38 cells. (Ga–b) β-galactosidase staining in control and MALAT1-depleted WI-38 cells. Gb denotes the percentage of β-gal +ve cells. (H) The relative expression of indicated senescence-associated genes is determined by qPCR from control and MALAT1-depleted WI-38. (I) The relative expression of indicated genes is assessed by qRT-PCR from proliferating (early passage) and replicative senescent (late passage) WI-38 cells. Note that replicative senescent cells show reduced levels of MALAT1. Mean ± SEM, *p = 2.5, z-test *p<0.05, ANOVA p-value< = 0.05 , false discovery rate < = 0.30, as well as the average gene expression values in each comparison groups were not negative. Further functional analyses were performed by using Parameterized Gene Set Enrichment (PAGE) algorithm with ALL of the genes on the array. **p<0.01 and ***p<0.0001. BrdU-propidium iodide (PI) flow cytometry For labeling of S-phase cells, BrdU was added in mid-log phase cells at a final concentration of 50 µM and incubated for 1 hr at 37°C. Cells were harvested and washed with PBS + 1% BSA. Cells were further resuspended in chilled 0.9% NaCl at a cell density of 2×10⁶ cells/ml and fixed in equal volume of ethanol and incubated at −20°C for 1 hr. Further, ethanol was removed and the cells were resuspended and incubated in 2N HCl + 0.5% Triton X-100 solution for 30 min at RT followed by washing in 0.1 M Sodium tetraborate solution. Finally, the cells were resuspended in PBS/0.5%Tween-20 + 1% BSA and incubated with anti-BrdU antibody for 1 hr at RT. The cells were washed again with the same buffer and incubated in PBS + PI/Triton X-100 at 37°C for 15 min. Cells were analyzed on a flow cytometer. Please see Protocol S1 and Table S6 for additional materials and methods. Supporting Information Figure S1 MALAT1 levels are cell cycle regulated and depletion of MALAT1 results in proliferation defects. (A) MALAT1 and Cyclin E levels in 10 and 15 hr post release serum-starved WI-38 cells are analyzed by qRT-PCR. Note that the MALAT1 levels increased during G1/S phase (G1/S is determined by the increased levels of cyclin E). Mean ± SEM, *p<0.05. (B) Expression of SRSF1 is determined by immunoblotting using extracts from cell cycle-synchronized U2OS cells. (C) Flow cytometry analyses of control (scr-oligo) and MALAT1-depleted (MALAT1-AS1 & AS2 antisense oligonucleotides) WI-38 cells. (D) Flow cytometry analyses of control (control-si) and MALAT1-depleted (using MALAT1-si1, -si2 & -si3 double stranded siRNA oligos) WI-38 cells. (E) Bright field low magnification images of control and MALAT1-depleted HDFs show changes in cellular morphology in MALAT1-depleted cells. (F) The relative expression of indicated genes is determined by qRT-PCR analyses from total RNA of control and MALAT1-depleted (using siRNA oligos) WI-38 cells. Mean ± SEM, *p<0.05, **p<0.01 and ***p<0.001. (PDF) Click here for additional data file. Figure S2 S2A (Aa–c) The relative expression of indicated genes determined by qRT-PCR from total RNA isolated from control (scr) and MALAT1-depleted (AS1 & AS2) WI-38 cells. (Ad) Changes in relative expression of indicated genes determined by qRT-PCR using total RNA from control (using control siRNA) and MALAT1-depleted (using MALAT1-specific siRNA) WI-38 cells. Note that MALAT1 depletion using double-stranded siRNA oligos also result in reduced expression of cell-cycle genes. (Ae) The relative expression of PCNA is determined by qRT-PCR (with 3 independent primer pairs) using RNA from control (scr) and MALAT1-depleted (AS1 & AS2) WI-38 cells. Note that MALAT1-depleted cells do not show changes in PCNA mRNA levels. Mean ± SEM, **p<0.01 and ***p<0.001. S2B: (Ba) Top significant biofunctions and (Bb) canonical pathways of the protein-coding genes that are upregulated in MALAT1-depleted fibroblasts. Note that the p53-signaling pathway is activated in MALAT1-depleted lung fibroblasts. (Bc) The relative expression of indicated genes is determined by qPCR using RNA from control (scr) and MALAT1-depleted (AS1 & AS2) WI-38 cells. Note that several of the upregulated genes are part of the p53-signaling pathway (Cdkn1a [p21], Gadd45a, Gadd45b, Il-6, Il-8, Mdm2, Tp53inp1). (Bd) qRT-PCR analyses reveal that transiently expressed MALAT1 rescues the expression of cell cycle genes (Mybl2, Ccna2, CenpE) in MALAT1-depleted HDFs. Mean ± SEM, *p<0.05 and **p<0.01. (PDF) Click here for additional data file. Figure S3 The relative levels of MALAT1 are determined by qRT-PCR analyses in RNA from serum starved (0 hr) and serum re-stimulated (24 & 36 hr) control (scr) and MALAT1-depleted (AS1 & AS2) WI-38 cells. ‘Async’ designates asynchronous WI-38 cells. (PDF) Click here for additional data file. Figure S4 p53 is a downstream mediator of MALAT1. (A) Co-immunolocalization of α- and γ-tubulin, (B) nucleoporin and lamin A/C in control and MALAT1-depleted HeLa cells. Note the presence of monopolar and highly condensed chromosomes in MALAT1-depleted cells (A). (C) MALAT1 RNA-FISH in control (control-si) and MALAT1-depleted (using MALAT1 siRNAs; si1 & si2) HeLa cells. (Da) MALAT1 RNA-FISH in human MALAT1-depleted HeLa cells that express mouse MALAT1. (Db) Percentage of mouse Malat1 expressing HeLa cells (as observed by MALAT1 RNA-FISH) with normal and broken nuclei upon human MALAT1 depletion. Note that the HeLa cells that express mouse MALAT1 do not show nuclear break down upon depletion of endogenous human MALAT1. (Ea–c) HeLa cells are synchronized in mitosis by nocodazole, incubated with control or MALAT1 antisense oligonucleotides and released for indicated time points to examine the role of MALAT1 in S-phase progression. (Ea) Flow cytometry analyses of control (scr-oligo) and MALAT1-depleted cells (AS1) post-mitotic release. (Eb) The relative MALAT1 RNA levels in control and MALAT1-depleted HeLa cells that are released (12, 15 & 18 hr) post nocodazole treatment. (Ec) BrdU-incorporation assays of control (scr) and MALAT1-depleted cells (AS1) post 12 hr nocodazole release. (F) Table showing the phenotypes (mitosis and cell cycle arrest) observed in several cell lines upon MALAT1 depletion. +++ maximum, ++ medium and + minor changes. ‘M’ designates for mitotic defects and ‘NP’ stands for no obvious phenotype. RKO cells showed cell death upon MALAT1 depletion. (Ga–b) MALAT1 RNA-FISH in control (scr-oligo) and MALAT1-depleted (AS1 & AS2) WI-38 and WI-38-VA13 (WI-38 cells stably expressing SV40-T-antigen). (Ha–c) Relative levels p16Ink4A (Ha), p53 (Hb) and MALAT1 (Hc) RNA is determined by qRT-PCR in WI-38 cells that are transfected with control (scr), p16Ink4A siRNA (p16si), p53 siRNA (p53si), MALAT1 antisense oligos (AS1), or combination of siRNAs with MALAT1 AS1. (I) Q-PCR analyses to determine the relative mRNA levels of MCM6 in serum starved WI-38 cells that are depleted of p53 or MALAT1 alone or p53 + MALAT1 followed by serum re-stimulation. Mean ± SEM, *p<0.05, **p<0.01 and ***p<0.001. The DNA is counterstained with DAPI. The scale bar represents 5 µm. (PDF) Click here for additional data file. Figure S5 Functional p53 is required for the S-phase arrest observed in MALAT1-depleted human cells. (A) The relative RNA levels of indicated genes in HDFs that are incubated with control (scr) or MALAT1 antisense oligonucleotides (AS1), and total RNA is isolated at indicated time points (12, 24 & 48 hr). Note that the E2F target mRNA (CDT1, MCM3) level is reduced after 24 hrs of MALAT1 depletion. (B) Relative RNA levels of indicated genes in control (scr) and MALAT1-depleted (AS1 & AS2) HCT116-WT and HCT116-p53 −/− cells. MALAT1-depleted HCT116 p53−/− cells do not show reduction in the levels of E2F target gene mRNAs. (Ca) Relative MALAT1 RNA levels in HDFs that are transiently transfected with control (vector) and human MALAT1 plasmids. (Cb) Immunoblot assay to detect the p53 in vector and human MALAT1 plasmid transfected HDFs. B″-U2snRNP is used as a loading control. (PDF) Click here for additional data file. Figure S6 MALAT1 is required for mitotic progression (A) Top significant canonical pathways of the cell cycle genes that are downregulated in MALAT1-depleted fibroblasts. Note that the expression of genes involved in mitotic progression is maximally affected upon MALAT1 depletion. (B) The yellow shaded genes in the pathway analysis diagram are downregulated in MALAT1-depleted fibroblasts, further emphasizing the involvement of MALAT1 in mitotic progression. (C) The relative MALAT1 RNA levels in mitotic (Noco), G1 (Noco 6 hr rel), G1/S synchronized HeLa cells (0 hr rel) and cells that are 12 and 24 hr released in presence of scrambled and MALAT1 antisense oligonucleotides. (D) Flow chart depicting the experimental design. HDFs (WI-38cells) are synchronized in G1/S by serum starvation followed by aphidicolin treatment, followed by MALAT1 depletion and released for 12 and 24 hr to examine the role of MALAT1 in S-phase and mitotic progression. (Ea) Percentage of mitotic cells and cells with broken nuclei in control and MALAT1-depleted HDFs post G1/S (12 and 24 hr) release. (Eb) DAPI-stained nuclei in control and MALAT1-depleted HDFs post 24 hr G1/S release. (F) Immuno-localization of α-tubulin and γ-tubulin in control and MALAT1-depleted WI-38 cells post G1/S (24 hr) release. Note that MALAT1-depleted diploid cells show mitotic segregation defects with monopolar asters. DNA is counterstained with DAPI. Scale bar represents 5 µm. (PDF) Click here for additional data file. Figure S7 (A) qRT-PCR analyses of SRSF1 RNA-IP samples from control and MALAT1-depleted HeLa cells reveal increased association of SRSF1 to indicated pre-mRNAs. (B) qRT-PCR analyses of T7 RNA-IP samples from control and T7-tagged SRSF1 over expressed HeLa cells reveal increased association of SRSF1 to indicated pre-mRNAs in T7-SRSF1 overexpressed cells. Mean ± SEM, *p<0.05, **p<0.01 and ***p<0.001. (Ca) Immunoblot analysis of SRSF1 in control (control siRNA oligo = luciferase gene siRNA; scr oligo = scrambled oligo against MALAT1 AS2 oligo), MALAT1-AS2) and Neat1-AS1 antisense oligo-treated HeLa cells. The cells are transfected with various concentrations (50, 100 & 200 nM) of siRNA or modified DNA antisense oligos using Lipofectamine RNAimax transfection reagent. The arrow designates the dephosphorylated SRSF1. (Cb) Immunoblot analysis of SRSF1 in control (control si), MALAT1-depleted (using double-stranded siRNAs; si1 & si2) HeLa cell extracts. (Cc) Immunoblot analysis of SRSF1 in control (scr-oligo) and MALAT1-depleted (AS2), MCF7, HeLa and WI-38 cell extracts. Note that the dephosphorylated SRSF1 is present only in MALAT1-depleted HeLa cells. (Cd) Immunoblot analysis of SRSF1 in control (scr-oligo or control siRNA), p53 or MALAT1 or p53 + MALAT1 co-depleted WI-38 cell extracts. Note that p53 and MALAT1 co-depleted WI-38 cells show increased levels of dephosphorylated SRSF1. (D) qRT-PCR using RNA from control and MALAT1-depleted HeLa cells to determine the relative expression of B-MYB. (E) Flow cytometry analyses of control and MALAT1-depleted G1/S synchronized (0 hr) and released (2–8 hr) HeLa cells reveal comparable cell cycle progression. (Fa–b) The relative levels of indicated mRNAs (E2F1 and B-MYB) in control (scr) and MALAT1-depleted (AS1) HDFs that are transiently transfected with vector or E2F1 eukaryotic expression plasmids. (G) The relative levels of MALAT1 are determined by qRT-PCR analyses in RNA from control and MALAT1 overexpressed WI-38 cells. (PDF) Click here for additional data file. Protocol S1 Supporting materials and methods. (DOCX) Click here for additional data file. Table S1 Gene expression changes upon knockdown of MALAT1 with Antisense oligo 1 (AS1) in WI-38 cells. (XLSX) Click here for additional data file. Table S2 Gene expression changes upon knockdown of MALAT1 with Antisense oligo 2 (AS2) in WI-38 cells. (XLSX) Click here for additional data file. Table S3 Common genes downregulated (Z-ratio ≥2.50) upon knockdown of MALAT1 with both antisense oligo 1 (AS1) or antisense oligo 2 (AS2) in WI-38 cells. (XLSX) Click here for additional data file. Table S4 Common genes up-regulated (Z-ratio≤2.50) upon knockdown of MALAT1 with both antisense oligo 1 (AS1) and antisense oligo 2 (AS2) in WI-38 cells. (XLSX) Click here for additional data file. Table S5 Effect of MALAT1 knockdown on alternative splicing. Antisense oligo 1 (AS1) and Antisense oligo 2 (AS2) are two independent antisense oligonucleotides that were used for MALAT1 knockdown in WI-38 cells. (XLSX) Click here for additional data file. Table S6 List of qRT-PCR primers and siRNAs or modified DNA antisense oligonucleotides used in the present study. (XLS) Click here for additional data file.