- Record: found
- Abstract: found
- Article: found
Cardiac magnetic resonance imaging for coregistration during ablation of ischemic ventricular tachycardia for identification of the critical isthmus
case-report
Livio Bertagnolli , MD
∗ ,
Federica Torri , MD,
Ingo Paetsch , MD,
Cosima Jahnke , MD,
Gerhard Hindricks , MD, FHRS,
Arash Arya , MD, FHRS,
Borislav Dinov , MD
22 November 2017
Read this article at
There is no author summary for this article yet. Authors can add summaries to their articles on ScienceOpen to make them more accessible to a non-specialist audience.
Abstract
Key Teaching Points
•
Magnetic resonance imaging is a useful method to predict the location of the arrhythmogenic
substrate of ischemic ventricular tachycardia (VT).
•
The Automatic Detection of Arrhythmic Substrate system can help understand the 3-dimensional
scar anatomy and can predict the location of an inhomogeneous conducting channel in
the scar area.
•
Pace mapping can help to individuate the channel responsible for the clinical VT and
the VT exit site.
Introduction
Catheter ablation of ventricular tachycardia (VT) has been proven to be an effective
therapy in patients with ischemic cardiomyopathy.
1
Activation mapping for stable VT and substrate-based mapping during sinus rhythm have
become the mainstay of VT ablation.
2
Preprocedural high-resolution late gadolinium–enhanced cardiac magnetic resonance
(LGE-CMR) imaging may be used for the purpose of scar characterization and for the
detection of conducting channels on the basis of the 3-dimensional (3D) distribution
of signal intensity variation within the left ventricular myocardium.
3
In the present case, we report on VT ablation guided by LGE-CMR imaging, which is
coregistered with electroanatomic voltage and activation maps.
Case report
An 83-year-old man with a history of inferolateral myocardial infarction was referred
to our hospital with recurrent hemodynamically stable VT unresponsive to antiarrhythmic
medications. On admission, initial echocardiography showed a reduced left ventricular
ejection fraction of 40%. Preprocedural 3D high-resolution LGE-CMR imaging was performed
(Ingenia 1.5T MRI system, Philips, Eindhoven, The Netherlands) 10 minutes after the
application of intravenous contrast (gadolinium-DTPA [diethylenetriaminepentaacetic]
0.2 mmol/kg; free-breathing, navigator-gated 3D inversion recovery sequence with individually
adapted inversion delay and near isotropic spatial resolution of 0.7 × 0.7 × 1.0 mm)
(Supplemental Figure 1). LGE-CMR images were processed off-line using a dedicated
software package (Automatic Detection of Arrhythmic Substrate, ADAS-VT, Galgo Medical
SL, Barcelona, Spain) with semi-automatic determination of endo- and epicardial borders
of the left ventricular myocardium and subsequent automatic characterization of an
internal 3D scar architecture on the basis of the CMR-signal intensity distribution
pattern. Left ventricular myocardial wall was split into layers using 10% steps from
the endocardium to the epicardium. Dense scar, heterogeneous tissue (“border zone”),
and normal tissue were differentiated using prescribed thresholds of >60% of the maximum
pixel intensity, 40% to 60%, and <40%, respectively.
4
Within the scar area, conducting channels were defined as a border zone corridor connecting
normal tissue (“healthy-to-healthy”). In a matching location, VT QRS morphology on
the surface electrocardiogram and ADAS-VT were suggestive of a VT-related channel
in the inferolateral wall, with the scar area extending to the mitro-aortic continuity.
Consequently, after an uncomplicated transseptal puncture, substrate mapping (electroanatomic
mapping) of the left ventricle was performed during sinus rhythm using a 1-mm multielectrode
mapping catheter (PentaRay, Biosense Webster Inc., Diamond Bar, CA). Bipolar signals
were filtered on a Prucka Cardiolab system (Prucka Inc., Milwaukee, WI) with a range
of 30–500 Hz. Voltage map was created in sinus rhythm, with the commonly applied thresholds
of 0.5–1.5 mV for scar and normal tissue
5
(Supplemental Figure 2). Afterward, the electroanatomic map was coregistered manually
with the LGE-CMR–based ADAS-VT shell using a 3D mapping system (CARTO 3, Biosense
Webster). During ongoing clinical VT, recordings from the PentaRay catheter located
in the scar area showed diastolic potentials in the PentaRay splines 9-10, 13-14,
and 17-18 (Figure 1). All mid-diastolic potentials were located within the ADAS-VT–identified
channel (Figure 2). In addition, using pace mapping from the PentaRay splines we could
identify the entrance and exit sites of the clinical VT at the corresponding exit
and entrance of the culprit channel on the LGE-CMR–based ADAS-VT image (Figures 1
and 3). After reinduction of VT, a radiofrequency line crossing the VT channel between
the mitral annulus and the inferior portion of the scar led to successful VT termination.
Finally, further ablation was carried out in order to eliminate late potentials in
the scar area, resulting in complete noninducibility of any VT.
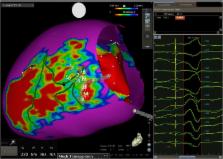
Figure 1
Three-dimensional scar reconstruction of a high-resolution late gadolinium–enhanced
cardiac magnetic resonance image merged with the CARTO-derived electroanatomic voltage
map. The position of the PentaRay catheter is demonstrated, with red circles indicating
respective electrodes in the ventricular tachycardia channel from the entrance to
the exit: 17-18, 13-14, and 9-10. Green lines indicate conducting channels as detected
on late gadolinium–enhanced cardiac magnetic resonance images (left); pace map from
electrodes 13-14 resulted in a PaSo score of 96.4% (right).
Figure 2
A: Ventricular tachycardia (VT) morphology on the 12-lead electrocardiogram. B: Electrograms
from the PentaRay splines during VT demonstrating activation through the VT-protected
isthmus: from 17-18 (prediastolic) to 13-14 (mid-diastolic) and 9-10 (end-diastolic).
Figure 3
A: During sinus rhythms, pacing from PentaRay electrodes 13-14 located in the middle
of the protected isthmus during ventricular tachycardia. B: Twelve-lead electrocardiogram
during stimulation from PentaRay 13-14 showing a clinical ventricular tachycardia
and paced QRS correlation of 96% (Figure 2) and a long S-QRS interval.
Discussion
LGE-CMR imaging is the recognized standard of reference for myocardial scar detection
and proved useful for substrate characterization before electrophysiological procedures.
Continuous corridors of intermediate signal intensity on LGE-CMR images interspersed
within dense LGE areas most likely represent the CMR equivalent of slow conduction
zones during VT. Using the ADAS-VT software, dedicated 3D reconstructions of left
ventricular myocardial layers in patients with post–myocardial infarction VT can identify
conducting channels and facilitate VT ablation. In the present case, simultaneous
recordings from the multielectrode mapping catheter located within the coregistered
LGE-CMR–defined 3D substrate provided electrophysiological evidence that the CMR-defined
channel architecture matched the critical isthmus of the clinical VT.
Conclusion
ADAS-VT software has the ability to characterize the myocardial fibrosis and potential
critical isthmus and reconstruct in 3-D the scar that could then be integrated in
a 3D-mapping system. This system seems to have also high capacity to detect the arrhythmogenic
substrate and the isthmus of the reentry circuits critical for VT generation. Further
studies are warranted to assess the feasibility of this technology.
Related collections
Most cited references4
- Record: found
- Abstract: found
- Article: not found
Late potentials abolition as an additional technique for reduction of arrhythmia recurrence in scar related ventricular tachycardia ablation.
- Record: found
- Abstract: found
- Article: not found
Integration of 3D electroanatomic maps and magnetic resonance scar characterization into the navigation system to guide ventricular tachycardia ablation.
David Andreu, Juan Armenta, Josep Brugada … (2011)
- Record: found
- Abstract: found
- Article: not found