- Record: found
- Abstract: not found
- Article: not found
The status of blood supply in sub-Saharan Africa: barriers and health impact
Author(s):
Lucy Asamoah-Akuoko ,
Bernard Appiah ,
Meghan Delaney ,
Bridon M'baya ,
Claude Tayou Tagny ,
Imelda Bates
Publication date Created:
July 2023
Publication date (Print):
July 2023
Journal:
The Lancet
Publisher:
Elsevier BV
Read this article at

There is no author summary for this article yet. Authors can add summaries to their articles on ScienceOpen to make them more accessible to a non-specialist audience.
Related collections
Most cited references10
- Record: found
- Abstract: found
- Article: not found
Sickle cell disease
Sickle cell disease (SCD) is a group of inherited disorders caused by mutations in HBB, which encodes haemoglobin subunit β. The incidence is estimated to be between 300,000 and 400,000 neonates globally each year, the majority in sub-Saharan Africa. Haemoglobin molecules that include mutant sickle β-globin subunits can polymerize; erythrocytes that contain mostly haemoglobin polymers assume a sickled form and are prone to haemolysis. Other pathophysiological mechanisms that contribute to the SCD phenotype are vaso-occlusion and activation of the immune system. SCD is characterized by a remarkable phenotypic complexity. Common acute complications are acute pain events, acute chest syndrome and stroke; chronic complications (including chronic kidney disease) can damage all organs. Hydroxycarbamide, blood transfusions and haematopoietic stem cell transplantation can reduce the severity of the disease. Early diagnosis is crucial to improve survival, and universal newborn screening programmes have been implemented in some countries but are challenging in low-income, high-burden settings.
- Record: found
- Abstract: found
- Article: found
Global Burden of Sickle Cell Anaemia in Children under Five, 2010–2050: Modelling Based on Demographics, Excess Mortality, and Interventions
Frédéric Piel, Simon Hay, Sunetra Gupta … (2013)
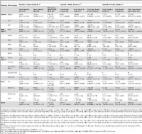
Introduction While considerable efforts are currently being invested into reducing the global burden of infectious diseases, particularly malaria, tuberculosis, and HIV [1],[2], the burden of birth defects has largely been neglected [3]–[5]. It has recently been estimated that more than 7 million babies are born each year with either a congenital abnormality or a genetic disease [3]. Five disorders constitute approximately 25% of these births, two of which, haemoglobinopathy and glucose-6-phosphate dehydrogenase deficiency, are monogenic diseases [6]. Amongst the haemoglobinopathies, sickle cell disease is by far the largest public health concern. Sickle haemoglobin (HbS) is a structural variant of normal adult haemoglobin (HbA) that is inherited as an autosomal recessive Mendelian trait. While heterozygote individuals are generally asymptomatic, homozygote individuals (i.e., those with SCA) suffer from lifelong acute and chronic complications [7]. Although sickle cell disorders include not only SCA but also co-inherited haemoglobin S and haemoglobin C (HbSC disease) or β-thalassaemia (HbS/β-thalassaemia), the present study focuses exclusively on SCA, the most severe and most common globally, accounting for an estimated 83% of all newborns with sickle cell disorders [8]. Because of evolutionary selection due to malaria protection, the highest frequencies of SCA are seen in tropical regions [9]. The vast majority of newborns with SCA occur in low- and middle-income countries. Without early diagnosis and treatment, most of those affected die during the first few years of life, with reported excess mortality reaching up to 92% [10]. Furthermore, infectious diseases have a role in causing increased severity of SCA [11],[12]. As low- and middle-income countries go through epidemiological transition and improve hygiene, nutrition, and public health policies and infrastructures, impressive reductions in overall infant and childhood mortality have started to be observed [13]–[16]. Following population migration, SCA is now seen throughout the world, as illustrated by the implementation of universal screening programmes in the United States of America, in the United Kingdom, and in French overseas territories. As it seems likely that human migration will continue to increase with further globalisation [17], the implementation of prevention measures, including diagnosis and counselling, in low- and middle-income countries will be of direct relevance for high-income countries. Awareness about the clinical and economic burden of SCA is rising, albeit slowly. In 2006, the World Health Organization (WHO) recognised SCA as a global public health problem [18]. In 2010, the 63rd World Health Assembly adopted a resolution on the prevention and management of birth defects, including sickle cell disease and the thalassaemias. Finally, haemoglobinopathies have been included in the most recent Global Burden of Diseases, Injuries, and Risk Factors Study (the GBD 2010 study), which aims at providing a comprehensive and systematic evidence-based assessment of the burden of major diseases and injuries [19]. Quantitative studies provide essential evidence on which to base public health decisions [20]. No such studies are currently available for either SCA or other birth defects. We recently estimated national allele frequencies for HbS using a contemporary database of representative population surveys and a Bayesian geostatistical framework [21]. By combining our estimates with high-resolution data on crude birth rates and population densities, we were able to estimate the global number of SCA-affected births by country for 2010. Here, we use these estimates and demographic projections to (i) assess the magnitude of the expected increase in the global burden of SCA between 2010 and 2050, (ii) identify the countries most likely to be affected by changes over the next decades, and (iii) provide quantitative evidence to guide public health decisions at global, regional, and national scales. Methods We conducted a quantitative investigation of the trends in the number of newborns with SCA at national, regional, and global scales. We then used a scenario-based approach that accounted for differences between low-, middle-, and high-income countries. Population movements are not considered in this study because of their unpredictable nature and a lack of systematic data for their prediction at the global level. Our model approach is summarised in Figure 1, and a worked example showing how values were calculated for Nigeria is presented in Table S1. A summary of the assumptions made in this study is shown in Table 1. 10.1371/journal.pmed.1001484.g001 Figure 1 Schematic overview of our model approach. Definition of variables: A, birth counts; B, frequency of SCA; C, mortality rate in under-five children; D, number of births with SCA; E, excess mortality in under-five children with SCA; i, scenario number, from 1 to 4; X, number of infants with SCA surviving; Y, number of lives of infants with SCA saved. U5, under five; UNPD, United Nations Population Division World Population Prospects [22]. 10.1371/journal.pmed.1001484.t001 Table 1 Summary of the assumptions and limitations of this study. Assumption Notes/Limitations We assumed that allele frequencies were constant over the study period (2010–2050). This is based on the slow kinetics of inherited disorders and on data from Jamaica [25], but it neglects the influence of population migrations because of their unpredictable nature. We have assumed the implementation of specific health interventions in 2015 to calculate the number of lives that could be saved. Although some countries are currently considering implementing specific interventions for SCA, it is impossible to predict when each country might implement such interventions and to which extent. We assumed that overall trends in the burden of SCA were driven by newborns. Data on the prevalence of SCA in adults is very limited, both in high- and low-income countries. Moreover, few studies have investigated SCA survival in adults. We assumed that it is possible to reduce excess mortality in under-five children to zero in high-income countries and to 5% in low- and middle-income countries. This is based on data from large-scale studies conducted in the United States, the United Kingdom, and Jamaica, summarised in Quinn et al. [34]. We assumed that information on consanguinity was too crude to be incorporated. There is currently no global and comprehensive database on consanguinity. We assumed that the implementation of specific interventions would lead to an immediate reduction of the excess mortality in newborns with SCA. This is supported by the proven efficacy of these interventions. Nevertheless, the rapidity with which they might be implemented may vary widely between countries. We assumed that focused care for children under 5 y would not detract from care for others, including parents and older patients with SCA. In the short term, improving the health of children under 5 y with SCA would increase awareness about this disease, which would inevitably benefit adults and older patients with SCA. In the long term, early diagnosis and appropriate health care helps prevent many of the serious clinical complications observed in adults with SCA. We assumed that data on the costs of implementing specific health interventions were too limited, particularly in low- and middle-income countries, to be incorporated into this study. Although data on the costs of these health interventions are available from various high-income countries, we could not find any published study presenting such data for low- and middle-income countries. Projected Number of Newborns with SCA Our projections of the number of newborns with SCA are based on the product of estimates of SCA frequency and projected birth counts. For SCA, we have used the median and interquartile range—the interval between the 25% and 75% quantiles of the predicted posterior distribution—of our own frequency estimates for 2010 [21]. Although only estimates of allele frequencies were previously published, SCA frequencies were also calculated within the Bayesian geostatistical framework used. For birth counts, we used medium-, low-, and high-fertility variant projections for 5-y periods between 2010 and 2050 from the 2010 revision of the United Nations World Population Prospects [22]. The lower bound of our confidence intervals (CIs) is based on the 25% quantile for SCA estimates and the low-fertility variant for birth counts. The higher bound of our CIs is based on the 75% quantile for SCA estimates and the high-fertility variant for birth counts. Data, with CIs, are presented for each country and for WHO regions, HbS regions (as defined in [21]), and the world in Table S2. We generated cartograms of the number of newborns with SCA in 2010, 2050, and over the period studied (2010–2050) (Figure 2) using the Cartogram Geoprocessing Tool in ArcGIS 10.1 (Esri). Cartograms are maps distorted proportionally to a variable other than land area or geographical space [23],[24]. They help to draw attention to regions or countries that are overrepresented or underrepresented when considering the particular variable mapped. 10.1371/journal.pmed.1001484.g002 Figure 2 Cartograms of the estimated number of newborns with SCA per country. Cartograms of the estimated number of newborns with SCA per country in 2010 (A), 2050 (B), and overall from 2010 to 2050 (C), based on data presented in Table S2. The estimates are based on the median of the posterior predictive distribution for SCA frequencies generated by our Bayesian geostatistical model described in Piel et al. [21] and the medium-fertility variant of the birth projections from the 2010 revision of the UN World Population Prospects [22]. We then ranked countries based on the magnitude of the absolute change in the estimated median number of newborns with SCA born between 2010 and 2050 (Table S2). Countries in which the increase in the number of newborns with SCA was the highest over the study period were assigned the lowest rank, while countries in which the decrease in the number of newborns with SCA was the highest over the study period were assigned the highest rank. Ranks are shown in Table S2. For illustrative purposes, we have limited this analysis to countries with a SCA frequency higher than 0.001 and in which more than 100 newborns with SCA were estimated for 2010 (Figure 3A). We applied a logarithmic transformation to further illustrate relative changes (Figure 3B). 10.1371/journal.pmed.1001484.g003 Figure 3 Country ranking based on estimated number of newborns with SCA in 2010 and 2050. Limited to countries for which the estimated median SCA frequency in 2010 was higher than 0.001 and the estimated number of newborns with SCA in 2010 was higher than 100. Lives Saved Scenarios Because of the inheritance mechanism of the sickle cell gene, changes in SCA allele frequency occur slowly, over generations [23],[24]. Studies conducted in Jamaica suggest that even in the absence of positive selection for heterozygotes the prevalence of newborns with SCA will remain stable over very long periods of time [25]. For the purposes of this analysis, we therefore assumed that the prevalence of newborns with SCA will remain constant during the period under study (2010–2050). Although few data are available regarding SCA mortality, particularly in the areas of highest prevalence, sharp reductions in SCA mortality in young children following the implementation of specific health measures are well documented in the US [26],[27] and Jamaica [28],[29]. Having calculated the baseline number of expected newborns with SCA at global, regional, and national scales by 5-y intervals from 2010–2050, we then tested the following four scenarios assuming the implementation in 2015 of the health measures described. (i) Scenario 1 represents our best assessment of the current situation: that in low- and middle-income countries, where the public health infrastructures required for the diagnosis and care of children with SCA are weak or absent, there is a 90% excess mortality among children under five with SCA, based on data from Fleming et al. [30] and Grosse et al. [10], but that in high-income countries with good access to public health infrastructures, the excess mortality is only 10%, based on data from Platt et al. [31]. Excess mortality is calculated as the difference between the frequency of SCA in newborns and in 5-y-olds, divided by the frequency of SCA in newborns [10]. The number of surviving children with SCA by age 5 y is therefore calculated as the number of newborns with SCA multiplied by the survival rate in the overall under-five population multiplied by the complement of the excess mortality in children with SCA (1−m excess). (ii) Scenario 2 represents a realistic short-term aim: to reduce the excess mortality to 50% in low- and middle-income countries, as described in Simpore et al. [32] and Grosse et al. [10] and to 5% in high-income countries, reflecting basic improvements in general public health infrastructures in both sets of countries. It seems likely that such improvements could be achieved by making penicillin prophylaxis and screening programmes or prenatal diagnosis widely available, [29]. (iii) Scenario 3 represents an optimistic aim that could correspond to the implementation of specific health measures targeting patients with SCA, such as widespread screening and the provision of specialised clinics: to reduce excess mortality to 10% in low- and middle-income countries and to eliminate it in high-income countries, based on recent data from Quinn et al. and Telfer et al. [33]–[35]. (iv) Scenario 4 represents the situation where a 5% excess mortality is observed in low- and middle-income countries and no excess mortality is observed in high-income countries [33]–[35]. A summary of these scenarios is presented in Table 2. By comparing Scenarios 2, 3, and 4 to Scenario 1, we calculated the number of lives that could be saved for the different levels of interventions considered. 10.1371/journal.pmed.1001484.t002 Table 2 Summary of the level of public health infrastructure and excess mortality considered per income class and for each of the four scenarios tested. Scenario Low-/Middle-Income Countries (GNIpc≤US$12,275) High-Income Countries (GNIpc>US$12,275) General Level of Public Health Infrastructures for Under-Five Children with SCA Excess Mortality in Under-Five Children with SCA General Level of Public Health Infrastructures for Under-Five Children with SCA Excess Mortality in Under-Five Children with SCA Scenario 1 Poor access to public health infrastructures 90% Good access to public health infrastructures 10% Scenario 2 Good access to public health infrastructures 50% Specific interventions for children with SCA (e.g., diagnosis, treatment) 5% Scenario 3 Specific interventions for children with SCA (e.g., diagnosis, treatment) 10% Universal screening programme (optimum) 0% Scenario 4 Universal screening programme 5% Universal screening programme (optimum) 0% Although the World Population Prospects [22] include migration data, only predictions of the net number of migrants are presented. Such data do not allow quantifying future fluxes between countries, which would be required for inclusion in the present study. We classified countries in four categories: low, middle low, middle high, and high income, based on their 2010 gross national income per capita (GNIpc), converted into US dollars, as calculated by the World Bank (http://data.worldbank.org/indicator/NY.GNP.PCAP.CD), and the World Bank income group classes (low income, US$1,005 or less; lower middle income, US$1,006–US$3,975; upper middle income, US$3,976–US$12,275; and high income, US$12,276 or more). For our mortality baseline, we used the U5m medium-, low-, and high-fertility variant projections for 5-y periods between 2010 and 2050 from the 2010 revision of the UN World Population Prospects [22]. Our economic indicator was the projected gross domestic product per capita (GDPpc) as published in the French Research Center in International Economics's BASELINE database (http://www.cepii.fr/anglaisgraph/bdd/baseline.htm). Full data on U5m and GDPpc are presented in Table S3. The capacity of countries to manage a changing number of newborns with SCA will depend on their current and future economic status and on the overall survival of children. To illustrate these changes, we created radar plots for each country displaying (i) the number of newborns with SCA based on United Nations medium-fertility variant projections, (ii) GDPpc, and (iii) U5m in 2010 and in 2050 (Figure 4). Radar plots represent an easy visualisation tool over time (within each country) and space (between countries). Moreover, they provide an appropriate, intuitive, and visually explicit ranking method for meta-analyses [36]. Each axis of the radar plots was scaled independently based on the minimum and maximum values of each indicator across all countries. 10.1371/journal.pmed.1001484.g004 Figure 4 Radar plots of newborns with SCA, gross domestic product, and under-five mortality for the DRC, Nigeria, and India. Radar plots for the DRC (A), Nigeria (B), and India (C). bSCA, estimated number of newborns with SCA. Results Projected Births and Newborns with SCA The world population is expected to increase from 6,896 million individuals in 2010 to 9,306 million in 2050 [22]. In many African countries, where SCA frequency is the highest [21], the overall number of births is expected to double during the period of time considered in this study [22]. As a consequence, when assuming constant gene frequencies, it is expected that the annual number of newborns with SCA, estimated to be 305,800 (CI: 238,400–398,800) globally in 2010, will likely increase by about one-third by 2050 (404,200 [CI: 242,500 (+2%)–657,600 (+65%)]) (Table 3). Globally, we estimated the overall number of births affected by SCA between 2010 and 2050 to be 14,242,000 (CI: 9,923,600–20,498,500). 10.1371/journal.pmed.1001484.t003 Table 3 Projected number of newborns with SCA born in 2010 and 2050 for the three most affected countries (Nigeria, India, and the DRC), WHO regions, HbS regions, and worldwide. Category Sub-Category 2010 2050 2010–2050 Number of Newborns with SCAa CIb Percent of Category Number of Newborns with SCAc (Change from 2010) CIb Percent of Category (Change from 2010) Number of Newborns with SCAd CIb Percent of Category Country Nigeria 91,011 [77,881–106,106] 29.8% 140,837 (+54.7) [95,487–200,604] 34.8% (+17.1) 4,600,639 [3,566,180–5,863,269] 32.3% India 44,425 [33,692–59,143] 14.5% 33,890 (−23.7) [15,936–64,740] 8.4% (−42.3) 1,605,013 [1,007,436–2,493,101] 11.3% DRC 39,743 [32,593–48,788] 13.0% 44,663 (+12.4) [27,062–70,542] 11.1% (−15.0) 1,761,226 [1,281,666–2,405,181] 12.4% WHO region e AFRO 237,381 [191,067–295,354] 77.6% 347,674 (+46.5) [217,838–536,072] 86.0% (+10.8) 11,697,397 [8,461,417–16,020,136] 82.1% AMRO 11,143 [6,305–19,823] 3.6% 9,596 (−13.9) [3,503–23,899] 2.4% (−34.9) 417,065 [195,281–862,232] 2.9% EMRO 10,559 [6,242–19,390] 3.5% 10,791 (+2.2) [4,529–26,235] 2.7% (−22.7) 433,457 [223,215–897,309] 3.0% EURO 1,939 [932–4,330] 0.6% 1,902 (−1.9) [604–5,717] 0.5% (−25.8) 75,897 [30,533–192,299] 0.5% SEARO 44,454 [33,696–59,338] 14.5% 33,910 (−23.7) [15,938–64,943] 8.4% (−42.3) 1,605,997 [1,007,529–2,501,090] 11.3% WPRO 6 [1]–[23] 0.0% 7 (+16.7) [1]–[36] 0.0% (−11.7) 249 [46–1,122] 0.0% HbS region f Eurasia 5,130 [2,474–11,179] 1.7% 4,478 (−12.7) [1,385–13,518] 1.1% (−34.0) 193,796 [77,985–484,394] 1.4% Americas 11,181 [6,324–19,896] 3.7% 9,628 (−13.9) [3,514–23,983] 2.4% (−34.9) 418,472 [195,879–865,325] 2.9% Sub-Saharan Africa 242,187 [194,549–302,012] 79.2% 353,533 (+46.0) [220,901–546,741] 87.5% (+10.4) 11,916,113 [8,599,975–16,361,830] 83.7% Southeast Asia 7 [1]–[32] 0.0% 8 (+14.3) [1]–[46] 0.0% (−13.5) 279 [48–1,503] 0.0% Arab-India 47,264 [35,050–65,640] 15.5% 36,540 (−22.7) [16,730–73,326] 9.0% (−41.5) 1,713,342 [1,049,712–2,784,723] 12.0% World 305,773 [238,400–398,775] 100% 404,190 (+32.2) [242,530–657,634] 100% — 14,242,002 [9,923,623–20,498,521] 100% Complete data for all countries are presented in Table S1. Proportions per category are indicated for the predicted newborns with SCA. Relative changes are shown within parentheses. a Calculated as the product between the median SCA frequency based on the model outputs described in Piel et al. [21] and the births per year for 2010–2015 from the 2010 revision of the UN World Population Prospects [22]. b CIs based on the interquartile range of the SCA frequency estimates and the low- and high-fertility variants for birth counts. c Calculated as the product between the median SCA frequency based on the model outputs described in Piel et al. [21], assuming constant allele frequencies over the study period and using the data on births per year for 2050–2055 from the 2010 revision of the UN World Population Prospects [22]. d Total estimated newborns with SCA born between 2010 and 2050. e As defined at http://www.who.int/about/regions/en/index.html. AFRO, African Region; AMRO, Region of the Americas; EMRO, Eastern Mediterranean Region; EURO, European Region; SEARO, Southeast Asia Region; WPRO, Western Pacific Region. f As shown in Web Figure 8 of Web Appendix 2 of Piel et al. [21]. Regionally, in 2010, an estimated 79% (242,200 [CI: 194,500 (82%)–302,000 (76%)]) of newborns with SCA occurred in sub-Saharan Africa (Table 3; Figure 2A). This proportion is expected to increase to 88% (353,500 [CI: 220,900 (91%)–546,700 (83%)]) by 2050 (Table 3; Figure 2B). In contrast, based on the UN demographic projections, the proportion of newborns with SCA in the other HbS regions (Eurasia, the Americas, and Arab-India), apart from Southeast Asia, where SCA burden is very small, is expected to decrease (Table 3). In 2010, we estimated that three countries (Nigeria, India, and the Democratic Republic of the Congo [DRC]) represented 57% (175,200 [CI: 144,200 (60%)–214,000 (54%)]) of the annual number of newborns with SCA globally (305,800 [CI: 238,400–398,800]). By 2050, these countries are projected to represent 55% (219,400 [CI: 138,500–335,900] amongst 404,200 [CI: 242,500–657,600]). But while the relative contribution of Nigeria is projected to increase from 30% (91,000 [CI: 77,900 (33%)–106,100 (27%)]) to 35% (140,800 [CI: 95,500 (39%)–200,600 (31%)]), the DRC's and India's relative contributions are expected to decrease from 13% (39,700 [CI: 32,600 (14%)–48,800 (12%)]) to 11% (44,700 [CI: 27,100 (11%)–70,500 (11%)]) and from 15% (44,400 [CI: 33,700 (15%)–59,100 (12%)]) to 8% (33,900 [CI: 15,900 (7%)–64,700 (10%)]), respectively. Projections for the three most affected countries, regions, and the world are plotted in Figure 5. Estimates for 2010, 2050, and 2010–2050 at national, regional, and global scales are presented in Table S2 and plotted for selected countries in Figure 3. 10.1371/journal.pmed.1001484.g005 Figure 5 Projections of estimated newborns with SCA between 2010 and 2050. Projections of estimated number of newborns with SCA (y-axis) between 2010 and 2050 for the DRC, India, and Nigeria (in blue); HbS regions: Eurasia, the Americas, sub-Saharan Africa, Southeast Asia, and Arab-India (in red; defined in Piel et al. [21]); and globally (in green). The dark-shaded areas represent the uncertainty in the demographic data. The light-shaded areas show the uncertainty associated with our estimates of SCA frequency. Estimated SCA Deaths and Lives Saved By comparing the results of our scenarios with additional interventions (Scenarios 2, 3, and 4) with the scenario based on current practice (Scenario 1), we estimated the number of lives that could be saved at different scales (Tables 4 and S1). A global transition from Scenario 1 to Scenario 2 in 2015, would save 113,500 [CI: 85,100–152,900] newborns in 2015 and a total of 5,302,900 [CI: 3,174,800–6,699,100] newborns by 2050. A similar transition to Scenario 3 would almost double the number of newborns saved in 2015 and overall between 2015 and 2050. Transitioning to Scenario 4 in 2015 would save 241,100 [CI: 180,800–324,900] newborns with SCA in 2015 and a total of 9,806,000 [CI: 6,745,800–14,232,700] by 2050. 10.1371/journal.pmed.1001484.t004 Table 4 Estimated number of lives saved of children with SCA in 2015, in 2050, and over the period 2015–2050 when comparing scenarios with reduced excess mortality (Scenarios 2, 3, and 4) to a status quo scenario (Scenario 1), based on the implementation of measures in 2015. Category Sub-category Scenario 2 versus Scenario 1a Scenario 3 versus Scenario 1b Scenario 4 versus Scenario 1c Lives Saved in 2015 [CI] Lives Saved in 2050 [CI] Total Lives Saved (2015–2050) [CI] Lives Saved in 2015 [CI] Lives Saved in 2050 [CI] Total Lives Saved (2015–2050) [CI] Lives Saved in 2015 [CI] Lives Saved in 2050 [CI] Total Lives Saved (2015–2050) [CI] Country Nigeria 34,741[28,773–41,690] 53,549[36,306–76,274] 1,711,430[1,160,127–1,952,218] 69,482[57,547–83,380] 397,648[336,247–76,274] 3,031,798[2,320,254–3,904,437] 73,825[61,144–88,591] 113,792[77,151–162,083] 3,221,285[2,465,270–4,148,464] India 16,361[11,454–23,155] 13,092[6,157–25,010] 630,710[319,393–837,820] 32,721[22,908–46,309] 120,817[86,408–25,010] 1,053,817[638,786–1,675,640] 34,766[24,340–49,204] 27,821[13,083–53,147] 1,119,681[678,710–1,780,368] DRC 14,018[11,067–17,793] 16,519[10,009–26,091] 627,816[390,316–757,135] 28,036[22,135–35,587] 155,491[123,659–26,091] 1,092,724[780,632–1,514,270] 29,788[23,518–37,811] 35,104[21,270–55,444] 1,161,019[829,421–1,608,911] WHO region d AFRO 89,925[69,859–115,437] 132,115[82,801–203,647] 4,355,115[2,740,435–5,321,803] 179,850[139,719–230,874] 1,002,895[793,528–203,647] 7,684,321[5,480,870–10,643,607] 191,088[148,449–245,300] 280,741[175,951–432,746] 8,164,498[5,823,366–11,308,690] AMRO 3,251[1,618–6,398] 2,587[857–6,922] 136,864[44,075–228,974] 6,502[3,236–12,796] 16,193[9,857–6,922] 206,191[88,149–457,948] 6,890[3,428–13,564] 5,475[1,812–14,663] 218,379[93,295–485,295] EMRO 3,692[2,034–7,249] 3,896[1,642–9,524] 161,779[67,300–285,853] 7,384[4,068–14,499] 28,836[17,542–9,524] 268,526[134,600–571,706] 7,838[4,318–15,393] 8,273[3,487–20,225] 285,083[142,896–607,008] EURO 225[110–528] 194[65–594] 15,558[3,140–18,794] 449[220–1,056] −1,360[307–594] 14,596[6,280–37,588] 468[230–1,099] 402[136–1,232] 15,168[6,545–39,061] SEARO 16,371[11,455–23,233] 13,100[6,157–25,090] 631,107[319,422–840,559] 32,743[22,910–46,466] 120,887[86,415–25,090] 1,054,474[638,845–1,681,117] 34,789[24,342–49,371] 27,838[13,084–53,317] 1,120,379[678,773–1,786,187] WPRO 0[0–2] 0[0–2] 38[2]–[61] 1[0–3] −9[−1–2] 22[4–122] 1[0–3] 1[0–4] 22[4–124] HbS region e Eurasia 1,322[587–3,108] 1,081[322–3,396] 59,763[16,530–111,629] 2,643[1,173–6,217] 5,432[3,544–3,396] 85,488[33,061–223,257] 2,796[1,241–6,578] 2,285[681–7,181] 90,406[34,959–236,177] Americas 3,266[1,625–6,428] 2,599[861–6,956] 137,441[44,274–230,058] 6,531[3,250–12,856] 16,294[9,907–6,956] 207,157[88,548–460,115] 6,921[3,442–13,628] 5,502[1,821–14,735] 219,406[93,719–487,597] Sub-Saharan Africa 91,802[71,156–118,143] 134,390[83,991–207,790] 4,439,957[2,786,376–5,438,922] 183,603[142,312–236,286] 1,020,601[805,975–207,790] 7,832,117[5,572,752–10,877,845] 195,076[151,205–251,051] 285,577[178,479–441,549] 8,321,531[5,920,991–11,557,568] Southeast Asia 1[0–5] 1[0–6] 50[2–192] 1[0–11] −7[0–6] 42[5–383] 1[0–11] 1[0–13] 44[5–401] Arab-India 17,107[11,723–25,232] 13,852[6,358–27,723] 665,630[327,632–918,006] 34,213[23,446–50,464] 124,906[88,233–27,723] 1,105,597[655,264–1,836,012] 36,345[24,908–53,608] 29,431[13,509–58,900] 1,174,501[696,117–1,950,391] GNIpc f Low 41,282[30,901–54,893] 59,152[35,094–95,569] 1,985,336[1,194,615–2,523,028] 82,564[61,802–109,785] 459,730[348,359–95,569] 3,500,023[2,389,229–5,046,056] 87,724[65,664–116,647] 125,699[74,575–203,084] 3,718,774[2,538,556–5,361,435] Middle low 68,632[52,343–91,080] 89,846[55,395–142,739] 3,153,383[1,929,209–3,929,860] 137,265[104,687–182,161] 694,920[548,682–142,739] 5,503,387[3,858,418–7,859,720] 145,844[111,230–193,546] 190,922[117,715–303,320] 5,847,349[4,099,569–8,350,952] Middle high 3,224[1,663–6,230] 2,544[898–6,586] 121,528[45,082–217,854] 6,448[3,326–12,461] 21,328[11,517–6,586] 201,353[90,164–435,708] 6,851[3,534–13,240] 5,405[1,909–13,995] 213,938[95,799–462,940] High 315[171–582] 336[136–780] 40,794[5,538–22,640] 630[343–1,164] −9,083[−993–780] 22,607[11,076–45,280] 630[343–1,164] 673[272–1,560] 22,607[11,076–45,280] World 113,498[85,091–152,924] 151,925[91,533–245,879] 5,302,904[3,174,823–6,699,064] 226,996[170,183–305,849] 1,167,238[907,660–245,879] 9,230,508[6,349,646–13,398,128] 241,143[180,798–324,891] 322,799[194,490–522,395] 9,806,002[6,745,807–14,232,681] a Calculated as the difference between the number of newborns with SCA surviving in Scenario 2 (50% and 5% excess mortality in low- and middle-income countries and high-income countries, respectively) and in Scenario 1 (90% and 10% excess mortality in low- and middle-income countries and high-income countries, respectively). CIs are based on the interquartile range of the SCA estimates and the low- and high-fertility variants of the projected birth counts. b Calculated as the difference between the number of newborns with SCA surviving in Scenario 3 (10% and 0% excess mortality in low- and middle-income countries and high-income countries, respectively) and in Scenario 1 (90% and 10% excess mortality in low- and middle-income countries and high-income countries, respectively). CIs are based on the interquartile range of the SCA estimates and the low- and high-fertility variants of the projected birth counts. c Calculated as the difference between the number of newborns with SCA surviving in Scenario 4 (5% and 0% excess mortality in low- and middle-income countries and high-income countries, respectively) and in Scenario 1 (90% and 10% excess mortality in low- and middle-income countries and high-income countries, respectively). CIs are based on the interquartile range of the SCA estimates and the low- and high-fertility variants of the projected birth counts. d As defined at http://www.who.int/about/regions/en/index.html. AFRO, African Region; AMRO, Region of the Americas; EMRO, Eastern Mediterranean Region; EURO, European Region; SEARO, Southeast Asia Region; WPRO, Western Pacific Region. e As shown in Web Figure 8 of Web Appendix 2 of Piel et al. [21]. f GNIpc in US dollars, based on the World Bank classification: low, US$1,005 or less; middle low, US$1,006–US$3,975; middle high, US$3,976–US$12,275; and high, US$12,276 or more. The vast majority of SCA-affected newborn lives that could be saved occur in sub-Saharan Africa. This is obvious when looking at the annual estimates for 2010 and 2050, but even more striking when looking at the overall calculations of lives lost over the 35-y projected period from 2015 to 2050 (Table 4). Nigeria's contribution to the global burden of SCA is particularly important. Based on GNIpc, more than 95% of the mortality burden among newborns with SCA will fall to low- and middle-low-income countries (Table 4). Our radar charts illustrate the different types of challenges that are faced by different countries (Figures 4 and S1). For example, in the DRC, the expected increase in the number of newborns with SCA (from 39,800 [CI: 32,600–48,800] to 44,700 [CI: 27,100–70,500]) will probably be accompanied by significant improvements in survival (reduction of U5m from 180 to 75 per 1,000). This will result in growing pressure on health care services during a period in which the economic status of the country is not expected to experience significant improvements (an increase in the GDPpc from US$3,812 to only US$4,135) (Figure 4A; Table S3). Nigeria will likely see a very large increase in the number of newborns with SCA (from 91,000 [CI: 77,900–106,100] in 2010 to 140,800 [CI: 95,500–200,600] in 2050), while U5m is projected to decrease from 141 to 49 per 1,000. This will aggravate the national health burden of SCA to an extent that will be poorly compensated by the projected increase in its GDPpc from US$2,137 to US$9,015 (Figure 4B; Table S3). Conversely, the situation seems a little less alarming in India, where we project that the number of newborns with SCA will decrease from 44,400 (CI: 33,700–59,100) to 33,900 (CI: 15,900–64,700), while GDPpc will increase by 6-fold (from US$3,062 to US$19,553) (Figure 4C; Table S3), a situation that will potentially make the SCA burden more manageable in that country. Discussion Despite slowly growing awareness about haemoglobinopathies, and sickle cell disorders in particular, epidemiological data on the prevalence and burden of these disorders are still lacking [6],[21],[37]. In difficult economic times, evidence-based studies to support public health decisions and spending become increasingly important [38]. It has been suggested that the burden of haemoglobinopathies is going to increase over the coming decades [6],[39]. Such an increase is largely driven by two factors: population growth and public health transition. This study is, to our knowledge, the first attempt to quantify the magnitude of such increases based on existing epidemiological estimates and demographic projections. Our study highlights major inequalities in the current global distribution of newborns with SCA that are unlikely to be reduced in the coming decades. Basic interventions targeted to the most affected countries could save the lives of almost 10 million children born with SCA in the next 35 y. The countries most affected face major challenges [37]. Currently, excess mortality in SCA patients in many low- and middle-income countries—most of whom remain undiagnosed—is extremely high, and SCA is often neglected in public health policies. It is anticipated that as overall U5m begins to fall because of improved nutrition and medical facilities, an increasing proportion of children under 5 y with SCA will survive long enough to reach medical attention. Public health improvements (including widespread use of prophylactic penicillin and vaccination) will help an increasing proportion of these children to survive through childhood and adulthood, and therefore to present for diagnosis and treatment (e.g., hydroxyurea, hospitalisation, transfusion) generating lifelong costs. The lack of interventions will inevitably lead to a large burden on the public health infrastructures and budgets of the countries most affected [40],[41]. This needs to be acknowledged by policy makers so that adequate planning can be used to save lives and keep treatment costs manageable. In the short term, the priority in countries with a high frequency of HbS is to identify affected births in order to provide appropriate treatment. Cheap diagnostic methods are available for HbS, and the cost-effectiveness of screening programmes has already been demonstrated [42],[43]. This study suggests that huge numbers of lives could be saved in Nigeria [44]–[46], the DRC [47]–[49], and India [50]–[52]. Some pilot screening programmes have recently started in these countries, but nationwide programmes are needed for a significant public health impact. In the long term, in the absence of a definitive treatment for SCA, the best intervention to reduce excess mortality caused by this disorder and to keep public health costs associated with the follow-up care of SCA patients through their lifetime manageable, especially in low-income countries, is to avoid the births of affected newborns [6],[37]. A good knowledge of individual status, including carriers, combined with a good education system about the inheritance mechanism of HbS and the risks associated might help reduce the number of newborns with SCA, but current evidence suggests that prenatal diagnosis and genetic counselling is more effective [40],[53]–[55]. Because of population diaspora, increasing admixture, and the absence of clinical symptoms in carriers, at-risk couples include a much larger subset of the population than originally estimated. Nevertheless, the idea that this disorder is confined to individuals of African origins is still common amongst the medical community, and this needs to change. Finally, it is essential to implement systems for monitoring temporal and spatial changes in the frequency of such disorders. In order to assess the efficiency of implemented policies, such systems need to collect reliable data from multiple health centres across a given country and to develop appropriate analytical methods. Despite its novelty, this study has several limitations. First, it focuses only on newborns. Very few morbidity and mortality data are available for SCA patients, particularly in low-income countries, where deaths are usually attributed to other causes. Until universal screening at the population level is implemented, it is crucial to gather information on the mortality of SCA patients in order to define the public health and economic costs associated with HbS. It is likely that public health interventions such as those described here would result in indirect benefits for other age groups, but appropriate care for adults with SCA is something that also needs to be considered. Second, we have assumed that the implementation of specific interventions would lead to an immediate reduction of the excess mortality in newborns with SCA [27],[29],[56]. Although the benefits of these interventions have been clearly demonstrated in studies conducted in high-income countries, their implementation in low- and middle-income countries, in which general health infrastructures are poor, might be more challenging than assumed in this study. In addition, data on the costs of implementing interventions for children with SCA in low- and middle-income countries are currently lacking. Further studies on issues such as these will be needed before the optimal use of resources in different economic contexts can be defined. Third, the clinical phenotype of sickle cell disorders is very broad, being influenced by both genetic factors (e.g., α-thalassaemia or high levels of haemoglobin F) and environmental factors (e.g., infections) [57]. Moreover, there is some evidence to suggest that the Arab-Indian haplotype is milder than the African haplotypes [58]–[60]. If this is confirmed by large-scale population surveys, the economic burden in countries in which this haplotype is predominant might be lower than that in countries where the African haplotypes are prevalent. Current evidence was too sparse to account for this in the present study. Fourth, consanguineous marriages considerably increase the risk of having children with SCA in areas where the allele frequency of HbS is high. Such marriages are common in the Middle East and in various population groups worldwide, but only limited data are available globally [61],[62]. Finally, we assumed constant allele frequencies over the time period studied (40 y) [24],[25]. This assumption, which is based on the slow kinetics of inherited disorders, neglects the influence of population migrations. The magnitude and direction of past and current intra- or international population movements, often caused by political instability, civil disturbances, or environmental disasters, are difficult to assess. Allele frequencies within one country can be highly heterogeneous, making assumptions based only on nationality highly uncertain. Furthermore, it is almost impossible to predict future movements. Accessing immigration data [63] and using mobile phone network data [64],[65] for international migrations would be possible, but this is currently beyond the scope of this project. Conclusion Multiple warnings regarding the effect of epidemiological and demographic transitions in low-income countries and their consequences for SCA burden have been published [6],[66]. By quantifying this increase from 2010 to 2050 using evidence-based data and identifying potential changes in the distribution of areas the most affected, we hope (i) to highlight further the need for greater awareness of SCA, appropriate public health policies, and funding; (ii) to guide the implementation of appropriate policies; and (iii) to provide a framework that could be applied to other birth defects. In most countries, the burden of SCA has so far not been recognised. Its long-term toll is nevertheless significant. These results highlight once more the need for further epidemiological collaborative studies, particularly in Nigeria, the DRC, and India, to define more accurately the current and future health burden of SCA. Supporting Information Figure S1 Radar plots for all countries. bSCA, estimated number of newborns with SCA. (PDF) Click here for additional data file. Table S1 Worked example of our model approach for Nigeria (GNIpc: US$1,180; middle-low-income level). (PDF) Click here for additional data file. Table S2 National, regional, and global SCA frequency (median and interquartile range), projected births (in thousands) with CI, and estimated number of newborns with SCA with CI. (PDF) Click here for additional data file. Table S3 Indirect economic and mortality indicators per country. (PDF) Click here for additional data file.
- Record: found
- Abstract: found
- Article: not found
Maternal mortality in sub-Saharan Africa: the contribution of ineffective blood transfusion services.
I Bates, G K Chapotera, S J McKew … (2008)
In sub-Saharan Africa, where blood supply is critically inadequate, severe haemorrhage is a leading cause of maternal deaths. The aim of this review was to estimate the impact of lack of blood on maternal deaths and identify reasons and potential solutions. Databases and websites from 1970 to 2007 were searched for information concerning maternal deaths and near misses due to haemorrhage in sub-Saharan Africa. Original studies that provided qualitative or quantitative information about blood transfusion services in relation to obstetric deaths or near misses were included. Data about maternal haemorrhage deaths associated with lack of blood for transfusion and reasons for blood shortages were extracted from the full text of articles by two independent reviewers using predesigned, piloted forms. Twenty of 37 selected studies described a direct association between maternal deaths and lack of blood transfusions. Five of 37 provided quantitative information which showed that overall 26% (16-72%) of maternal haemorrhage deaths were due to lack of blood. Reasons included nonaffordability of blood, lack of blood donors, unwillingness of relatives to donate and inadequate supplies and transport. Lack of blood for emergency transfusions is a major, but poorly quantified and under-researched cause of maternal deaths in sub-Saharan Africa. Potential solutions include more blood donations, better financing mechanisms and more efficient management systems. Complementary approaches to prevent severe anaemia and treat hypovolaemia are important to reduce use of transfusions.
Author and article information
Journal
Title:
The Lancet
Abbreviated Title:
The Lancet
Publisher:
Elsevier BV
ISSN
(Print):
01406736
Publication date Created:
July
2023
Publication date
(Print):
July
2023
Volume: 402
Issue: 10398
Pages: 274-276
Article
DOI: 10.1016/S0140-6736(23)01164-9
PubMed ID: 37327797
SO-VID: efff4c5e-33e2-4459-ae75-7914cd310fc0
Copyright © ©
2023
History
Data availability: