41
views
0
recommends
+1 Recommend
0 collections
    0
    shares
      • Record: found
      • Abstract: found
      • Article: found
      Is Open Access

      Underexplored diversity of gill monogeneans in cichlids from Lake Tanganyika: eight new species of Cichlidogyrus Paperna, 1960 (Monogenea: Dactylogyridae) from the northern basin of the lake, with remarks on the vagina and the heel of the male copulatory organ

      research-article

      Read this article at

      Bookmark
          There is no author summary for this article yet. Authors can add summaries to their articles on ScienceOpen to make them more accessible to a non-specialist audience.

          Abstract

          Background

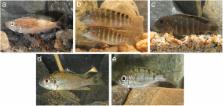
          Lake Tanganyika harbours the most diverse cichlid assemblage of the Great African Lakes. Considering its cichlid flocks consist of approximately 250 endemic species, we can hypothesize a high species-richness in their often quite host-specific monogenean ectoparasites belonging to Cichlidogyrus Paperna, 1960. Yet, only 24 species were described from Tanganyikan hosts and some host tribes have never been investigated for monogeneans. This study presents the first parasitological examination of species of the tribes Cyprichromini ( Cyprichromis microlepidotus (Poll, 1956)), Eretmodini ( Eretmodus marksmithi Burgess, 2012 and Tanganicodus irsacae Poll, 1950) and Ectodini ( Aulonocranus dewindti (Boulenger, 1899)). Specimens of the ectodine Ophthalmotilapia nasuta (Poll & Matthes, 1962) from which four Cichlidogyrus spp. have been previously described from more southern localities were also studied. Further, we discuss the haptor configuration in Tanganyikan Cichlidogyrus spp. and highlight the morphological diversity of the vagina, and that of the heel, a sclerotized part of the male copulatory organ, absent in some species of Cichlidogyrus.

          Methods

          Cichlidogyrus spp. were isolated from gills and fixed using GAP. Haptoral and genital hard parts were measured and drawn by means of a phase contrast microscopic examination.

          Results

          We describe eight new species: Cichlidogyrus milangelnari n. sp. on C. microlepidotus; C. jeanloujustinei n. sp. on E. marksmithi; C. evikae n. sp. on T. irsacae; C. aspiralis n. sp., C. glacicremoratus n. sp. and C. rectangulus n. sp. on O. nasuta; and C. pseudoaspiralis n. sp. and C. discophonum n. sp. on A. dewindti. Three haptoral morphotypes were recognized among the new species. Species of Cichlidogyrus from closely related hosts exhibited the same morphotypes. Geographical variation in Cichlidogyrus spp. fauna as observed in O. nasuta and three morphotypes were distinguished. Finally, we listed 111 Cichlidogyrus species, of which 27 and three Tanganyikan species lack sclerotized vagina and heel, respectively, just like 19 and seven species outside of the lake.

          Conclusions

          Haptoral and genital features in the Tanganyikan Cichlidogyrus fauna reflect the phylogenetic relationships of their cichlid hosts. It seems that several lineages of Cichlidogyrus spp. exist in Lake Tanganyika but further studies are necessary to confirm this hypothesis and answer questions related to Lake Tanganyika and its cichlids.

          Electronic supplementary material

          The online version of this article (10.1186/s13071-017-2460-6) contains supplementary material, which is available to authorized users.

          Related collections

          Most cited references58

          • Record: found
          • Abstract: found
          • Article: not found

          Lake level fluctuations synchronize genetic divergences of cichlid fishes in African lakes.

          Water level fluctuations are important modulators of speciation processes in tropical lakes, in that they temporarily form or break down barriers to gene flow among adjacent populations and/or incipient species. Time estimates of the most recent major lowstands of the three African Great Lakes are thus crucial to infer the relative timescales of explosive speciation events in cichlid species flocks. Our approach combines geological evidence with genetic divergence data of cichlid fishes from the three Great East African Lakes derived from the fastest-evolving mtDNA segment. Thereby, we show for each of the three lakes that individuals sampled from several populations which are currently isolated by long geographic distances and/or deep water form clusters of equally closely related haplotypes. The distribution of identical or equally closely related haplotypes in a lake basin allows delineation of the extent of lake level fluctuations. Our data suggest that the same climatic phenomenon synchronized the onset of genetic divergence of lineages in all three species flocks, such that their most recent evolutionary history seems to be linked to the same external modulators of adaptive radiation. A calibration of the molecular clock of the control region was elaborated by gauging the age of the Lake Malawi species flock through the divergence among the utaka-cichlid and the mbuna-cichlid lineages to minimally 570,000 years and maximally 1 Myr. This suggests that the low-lake-level period which established the observed patterns of genetic relatedness dates back less than 57,000 years, probably even to 17,000-12,400 years ago, when Lake Victoria dried up and Lakes Malawi and Tanganyika were also low. A rapid rise of all three lakes about 11,000 years ago established the large-scale population subdivisions observed today. Over that period of time, a multitude of species originated in Lakes Malawi and Victoria with an impressive degree of morphological and ecological differentiation, whereas the Tanganyikan taxa that were exposed to the same habitat changes hardly diverged ecologically and morphologically. Our findings also show that patterns of genetic divergences of stenotopic organisms provide valuable feedback on geological and sedimentological time estimates for lake level changes.
            Bookmark
            • Record: found
            • Abstract: found
            • Article: not found

            Specificity and specialization of congeneric monogeneans parasitizing cyprinid fish.

            Patterns and likely processes connected with evolution of host specificity in congeneric monogeneans parasitizing fish species of the Cyprinidae were investigated. A total of 51 Dactylogyrus species was included. We investigated (1) the link between host specificity and parasite phylogeny; (2) the morphometric correlates of host specificity, parasite body size, and variables of attachment organs important for host specificity; (3) the evolution of morphological adaptation, that is, attachment organ; (4) the determinants of host specificity following the hypothesis of specialization on more predictable resources considering maximal body size, maximal longevity, and abundance as measures of host predictability; and (5) the potential link between host specificity and parasite diversification. Host specificity, expressed as an index of host specificity including phylogenetic and taxonomic relatedness of hosts, was partially associated with parasite phylogeny, but no significant contribution of host phylogeny was found. The mapping of host specificity into the phylogenetic tree suggests that being specialist is not a derived condition for Dactylogyrus species. The different morphometric traits of the attachment apparatus seem to be selected in connection with specialization of specialist parasites and other traits favored as adaptations in generalist parasites. Parasites widespread on several host species reach higher abundance within hosts, which supports the hypothesis of ecological specialization. When separating specialists and generalists, we confirmed the hypothesis of specialization on a predictable resource; that is, specialists with larger anchors tend to live on fish species with larger body size and greater longevity, which could be also interpreted as a mechanism for optimizing morphological adaptation. We demonstrated that ecology of host species could also be recognized as an important determinant of host specificity. The mapping of morphological characters of the attachment organ onto the parasite phylogenetic tree reveals that morphological evolution of the attachment organ is connected with host specificity in the context of fish relatedness, especially at the level of host subfamilies. Finally, we did not find that host specificity leads to parasite diversification in congeneric monogeneans.
              Bookmark
              • Record: found
              • Abstract: found
              • Article: found
              Is Open Access

              A tribal level phylogeny of Lake Tanganyika cichlid fishes based on a genomic multi-marker approach

              1 Introduction The species-flocks of cichlid fishes in the East African Great Lakes Victoria, Malawi and Tanganyika (LT) represent the most species-rich adaptive radiations known in vertebrates (see e.g. Kocher, 2004; Salzburger, 2009; Seehausen, 2006). Several hundred of endemic cichlid species have evolved in each of these lakes in only the last few million to several thousand of years (see e.g. Genner et al., 2007; Kocher, 2004; Salzburger, 2009; Salzburger and Meyer, 2004; Snoeks, 2000; Turner et al., 2001; Verheyen et al., 2003). Because of their taxonomic diversity, their ecological and morphological disparity and the high proportion of endemism, East African cichlid fishes are a prime model system in evolutionary biology (reviewed in: Kocher, 2004; Salzburger, 2009; Santos and Salzburger, 2012). With a maximum estimated age of 9–12 million years (my), LT is the oldest lake in Africa (Cohen et al., 1997; Salzburger et al., 2014) and contains the genetically, morphologically and ecologically most diverse group of cichlid fishes counting ca. 200 species in more than 50 genera (Koblmüller et al., 2008b; Salzburger et al., 2002a; Snoeks, 2000). Based on morphological grounds, Poll (1986) grouped the LT cichlid species into 12 tribes (a taxonomic rank between subfamily and genus): Bathybatini, Cyprichromini, Ectodini, Eretmodini, Haplochromini, Lamprologini, Limnochromini, Perissodini, Tilapiini, Trematocarini, Tropheini, and Tylochromini. Takahashi (2003) revised Poll’s tribal assignment and suggested to (i) taking Boulengerochromis microlepis out of the Tilapiini into its own tribe, Boulengerochromini, leaving behind Oreochromis tanganicae as the only representative of the Tilapiini in LT; (ii) splitting the Limnochromini into Limnochromini sensu stricto, Benthochromini and Greenwoodochromini; (iii) establishing a separate tribe, Cyphotilapiini, for Cyphotilapia frontosa and C. gibberosa; (iv) moving ‘Ctenochromis’ benthicola into its own tribe; and (v) putting the species of the Trematocarini into the Bathybatini. Only some of these revisions are backed up by molecular data, such as the establishment of the new tribes Benthochromini, Boulengerochromini, and Cyphotilapiini (Koblmüller et al., 2008b; Muschick et al., 2012; Salzburger et al., 2002a). Greenwoodochromis, on the other hand, is clearly nested within the Limnochromini in molecular phylogenies (Duftner et al., 2005; Muschick et al., 2012; Kirchberger et al., 2014), and should hence remain within the Limnochromini; the Trematocarini consistently form a separate lineage outside the Bathybatini (see e.g. Koblmüller et al., 2005; Muschick et al., 2012) and should remain in their own tribe (note that Koblmüller et al. (2008b) suggested splitting the Bathybatini into Bathybatini sensu stricto and Hemibatini); and ‘Ctenochromis’ benthicola has recently been identified as member of the Cyphotilapiini (Muschick et al., 2012). Finally, the Tropheini were consistently found to be nested within the Haplochromini (Salzburger et al., 2005, 2002a; see also below) and should, hence, not be considered as separate tribe but as part of the Haplochromini. Not all of the cichlid tribes occurring in LT are endemic to this lake, though, and four tribes show a distribution range that exceeds the LT basin by far. The Tylochromini have their center of divergence in West Africa (Stiassny, 1990), and the only LT species, T. polylepis, is likely to have invaded LT only recently (Koch et al., 2007). The same might be true for O. tanganicae, the only native representative of the widely distributed Tilapiini in LT (Klett and Meyer, 2002). Note that the Tilapiini were recently taxonomically revised and that the genus Oreochromis has been placed into a new tribe, namely the Oreochromini (Dunz and Schliewen, 2013). The Lamprologini, the most species-rich tribe of cichlids in LT, contain a few species that have secondarily colonized the Congo and Malagarasi River systems (Salzburger et al., 2002a; Schelly et al., 2003; Schelly and Stiassny, 2004; Sturmbauer et al., 2010). The Haplochromini (including the Tropheini) represent the most species-rich tribe of cichlids overall, and are distributed across large parts of Africa, where they have seeded various radiations including the ones of Lake Malawi and the Lake Victoria Region (Koblmüller et al., 2008a; Salzburger et al., 2005; Schwarzer et al., 2012; Verheyen et al., 2003; Wagner et al., 2012). The LT cichlid fishes thus show faunal affinities across a large geographical range to both older cichlid lineages such as the Tylochromini and Tilapiini/Oreochromini and younger ones such as the Haplochromini. The phylogenetic relationships among East African cichlid tribes has been the subject of various studies over the past two decades, yet remain enigmatic (reviewed in: Koblmüller et al., 2008b). The first comprehensive phylogenetic study of LT’s cichlid fishes using molecular information dates back to the early 1990s, when Nishida (1991) used allozyme data to examine the relationships among tribes. He established the so-called ‘H-lineage’ consisting of the tribes Cyprichromini, Ectodini, Eretmodini, Haplochromini/Tropheini (which he already found to be monophyletic), Limnochromini, and Perissodini as sister-group to the Lamprologini; the Bathybatini, Trematocarini plus Boulengerochromis microlepis, Oreochromis tanganicae, and Tylochromis polylepis were placed outside of a clade formed by the ‘H-lineage’ and Lamprologini. Yet, the relative position of the ‘H-lineage’ tribes differed depending on the algorithms used (UPGMA and neighbour-joining; NJ) (Fig. 1a). Sturmbauer and Meyer (1993) used two mitochondrial (mt) DNA markers (cytochrome b and control region) and suggested, based on phylogenetic analyses with NJ and maximum parsimony (MP), a sister-group relationship between the Cyprichromini and the Ectodini and between the Eretmodini and the Haplochromini (Fig. 1b). Kocher et al. (1995) established the mitochondrial NADH dehydrogenase subunit 2 (ND2) gene as marker for phylogenetic analyses in cichlid fishes and provided the most inclusive phylogenetic hypothesis for LT cichlids so far. In their MP and NJ phylogenies, the Bathybatini, the Tylochromini, B. microlepis and O. tanganicae formed a clade, and the Eretmodini were placed outside the ‘H-lineage’, as sister-group to the Lamprologini (Fig. 1c). The Cyprichromini were resolved as the sister-group to all remaining ‘H-lineage’ taxa (i.e. without the Eretmodini). Using three mitochondrial markers (control region, cytochrome b, ND2) and NJ, MP and maximum-likelihood (ML) phylogenetic analyses, Salzburger et al. (2002a) confirmed the position of B. microlepis, the Bathybatini and the Trematocarini outside all other tribes occurring in Lake Tanganyika, with the exception of the Tylochromini, and the Eretmodini were placed as sister-group to the Lamprologini and the remaining ‘H-lineage’ tribes (Fig. 1d). Within the ‘H-lineage’, the Ectodini appeared as the sister to the remaining taxa. This study was also the first to establish phylogenetic affinities between the LT cichlid fishes and the riverine genus Orthochromis (not shown in Fig. 1d; see also Salzburger et al., 2005). Clabaut et al. (2005) combined sequences of the mitochondrial ND2 gene and the nuclear recombinase activating gene (rag) and applied ML and Bayesian inference (BI). They placed the Eretmodini as sister-group to the Lamprologini and established the ‘C-lineage’, i.e. the ‘H-lineage’ of Nishida (1991) but without the Eretmodini. Within this ‘C-lineage’, the Limnochromini plus C. frontosa appeared as the sister-group to the Perissodini, the Ectodini, the Cyprichromini and the Haplochromini (Fig. 1e). Day et al. (2008) provided one of the most comprehensive datasets to date (cytochrome b, ND2) including 157 taxa. Their ML and BI phylogenies supported the existence of the ‘C-lineage’ by placing the Eretmodini as sister-group to the Lamprologini. In their analyses, a clade formed by the Ectodini and Cyprichromini was placed as the sister-group of the remaining ‘C-lineage’ taxa (Fig. 1f). In the ML phylogeny of Muschick et al. (2012), who used the mitochondrial ND2 gene and two nuclear markers (ednrb1, phpt1), the Eretmodini were placed as sister group to the Lamprologini and the ‘C-lineage’, within which the Limnochromini appeared outside of all other included taxa (Fig. 1g). The study of Friedman et al. (2013), which was based on ten nuclear makers and did not focus specifically on the species of LT but on a larger cichlid phylogeny, revealed a clade formed by the Lamprologini, the Perissodini plus the Cyprichromini, and the Cyphotilapiini plus the Limnochromini as sister group to the Ectodini, the Eretmodini and the Haplochromini (Fig. 1h). In summary, after more than 20 years of research, the composition of individual LT tribes has been well investigated, whereas the phylogenetic relationships among these cichlid tribes remain largely elusive. All studies performed so far revealed different results (Fig. 1), and the support values for many of the deeper nodes were consistently low. While there is consensus about the position of T. polylepis, O. tanganicae, the Bathybatini, Boulengerochromini and Trematocarini outside of the other tribes, the following main areas of uncertainty persist: (i) the relative position of the Bathybatini, Boulengerochromini and Trematocarini to each other; (ii) the placement of the Eretmodini, which were suggested as either being part of the ‘H-lineage’ and sister to the Haplochromini (Friedman et al., 2013; Nishida, 1991; Sturmbauer and Meyer, 1993), as sister-group to the Lamprologini (Clabaut et al., 2005; Day et al., 2008; Kocher et al., 1995), or as separate lineage outside the Lamprologini-‘C-lineage’ clade (Muschick et al., 2012; Salzburger et al., 2002a); and (iii) the relative position of the ‘H-lineage’/’C-lineage’ taxa with respect to each other. The apparent intricacy with resolving the phylogenetic relationships of the cichlid tribes in LT might have various reasons. First, the conflict between the various phylogenetic hypotheses might in part result from the different phylogenetic algorithms used (see above), although this would not apply to the more recent studies, all of which relied on ML and BI methods. Second, we might face the problem here that the previously used markers do not provide enough power of resolution for the question at hand. Alternatively, the inability to resolve some of the phylogenetic relationships of LT’s cichlid tribes might reflect biological reality in the context of an adaptive radiation, where speciation is not necessarily bifurcating and multiple lineages may evolve nearly contemporaneously from a common ancestor (‘soft polytomy’ versus ‘hard polytomy’ problem: Maddison, 1989; Slowinski, 2001; Sturmbauer et al., 2003; Walsh et al., 1999; Whitfield and Lockhart, 2007). Conflicting topologies may also be the result of reticulate evolution due to (introgressive) hybridization, which is a commonly observed phenomenon in LT’s cichlid assemblage (e.g. Koblmüller et al., 2007; Salzburger et al., 2002b) and might have acted as trigger of cichlid adaptive radiations in the first place (Joyce et al., 2011; Seehausen, 2004). Finally, discordance between different sets of markers could reflect incomplete lineage sorting, which is expected to have a strong impact on phylogenetic inference in rapidly diversifying clades (Kubatko and Degnan, 2007) and has been demonstrated in LT cichlid fishes before (Takahashi et al., 2001). With decreasing sequencing costs and increasing computational resources, single marker and mtDNA-based phylogenies are rapidly being replaced by phylogenies inferred from large-scale nuclear marker sets based on selected loci, transcriptomes, or even whole genomes (McCormack et al., 2013). This recent development enables comparisons between the phylogenetic histories of multiple sets of individual markers. Here, we analyze the phylogenetic history of cichlid fishes from LT on a tribal level, including representatives from the East African Lakes Victoria and Malawi. We sampled 45 species and 42 nuclear loci and thus assembled the largest DNA sequence dataset available for LT cichlid fishes to date. In order to account for potential hybridization and incomplete lineage sorting, we explore gene tree concordance in addition to concatenation as ways for species tree estimation. We further test the strength of our dataset using random resampling of different numbers of markers. 2 Material and methods 2.1 Sample collection and DNA extraction Specimens for this study were collected between 2007 and 2011 at the Kafue River (Kafue National Park) and at LT in the Northern Province of the Republic of Zambia following the standard operating procedure described in Muschick et al. (2012). Additional samples were obtained from aquaria stocks at the University of Basel and at EAWAG, Kastanienbaum, Switzerland. In total, we analyzed data for 45 specimens, each representing a different East African cichlid species. Our sampling comprised 34 cichlid species from LT covering all major cichlid lineages in this lake. In addition we included 11 further species of riverine clades and from Lakes Victoria and Malawi, to place the LT cichlid taxa into a larger phylogenetic context. A detailed list of specimens, their IDs and sample locations is provided in Table S1. Genomic DNA was extracted from ethanol preserved tissue of whole specimens (see Muschick et al., 2012 for details). 2.2 Marker selection, sequencing and quality control To infer the phylogenetic history of the cichlid fishes of LT on the basis of an informative set of nuclear (nc) DNA markers, we selected a set of 42 nuclear loci. Twenty-four primer pairs were taken from earlier studies (Meyer and Salzburger, 2012; Muschick et al., 2012; Won et al., 2005) and 18 primer pairs were newly designed following the strategy described in Meyer and Salzburger (2012). In short, we selected genes with known functions and aimed for amplification products between 400 and 600 bp in length to enable the application of next-generation amplicon sequencing. Twenty-four of the markers were developed as exon-primed intron crossing (so-called EPIC) primers (Lessa, 1992; Slade et al., 1993). The markers for enc1, ptr, tbr and snx33 were taken from Li et al. (2007), but modified to meet our requirements. The same strategy was applied for ednrb (Lang et al., 2006), bmp4 (Albertson et al., 2003), and the reverse primer of s7 (Chow and Hazama, 1998). The genome of the Nile Tilapia (Oreochromis niloticus) (Brawand et al., 2014) was used to define exon–intron boundaries and UTRs. A detailed list of all primers, their base composition, the length of the amplification products, their source, the ENSEBML reference of the respective locus in Tilapia, the chromosomal position of the respective locus in the Medaka genome and the number of variable sites are provided in Tables 1 and 2. The 42 nuclear markers were PCR amplified in several separate multiplex reactions in a final volume of 25 μL on a Veriti or 2720 thermal cycler (both Applied Biosystems, Rotkreuz, Switzerland). All PCR reactions contained the Multiplex PCR Kit (QIAGEN, Hombrechtikon, Switzerland) and a primer mix including eight to ten barcoded primer pairs (0.1 μM of each primer), water, and template DNA (5–20 ng/μL). We used barcoded fusion primers synthesized by Microsynth (Balgach, Switzerland). The PCR conditions were standardized for all reactions with an initial heat activation phase of 95 °C for 15 min, followed by 35 amplification cycles with denaturation steps at 94 °C for 30 s, annealing steps at 60–62 °C for 90 s and extension steps at 72 °C for 90 s; reactions were completed by a final extension phase at 72 °C for 10 min. To remove small fragments, residual primers and primer-dimers, we applied the Agencourt AMPure XP magnetic bead system following the manufacturer’s protocol (Beckman Coulter, Nyon, Switzerland) and using a bead/DNA ratio of 1:1. Purification results were inspected with a 2100 Bioanalyzer (Agilent, Basel, Switzerland) using the DNA 1000 Kit. The amplification products of five individual PCR reactions with different primer combinations were then pooled (on the basis of the concentration measurements with the Bioanalyzer) to obtain the final libraries containing all 42 markers of one individual. In a second pooling step, 16 barcoded individuals were pooled for one 1/16th run on a 454 PicoTiterPlate. The subsequent library handling and sequencing was conducted by Microsynth (Balgach, Switzerland) with the GS FLX system (454 Sequencing, Roche). Sequencing was unidirectional starting at the forward primer, which also contained the barcodes. Individual sequences (in both fasta and fastq format) were separated and extracted with Roche’s sffinfo tool (described in 454 Sequencing System Software Manual Version 2.6). Quality control was conducted with the software PRINSEQ (v0.20.3) (Schmieder and Edwards, 2011). We excluded individual reads that were shorter than 150 bp, that had an average Phred quality score below 15, or that contained more than 1% unidentified bases coded as “N”. In a second step, we filtered out exact duplicates. The assembly to reference sequences from the A. burtoni genome (Brawand et al., 2014) was performed with the software bwa and the BWA-SW algorithm (the Burrows-Wheeler Aligner’s Smith-Waterman Alignment) (Li and Durbin, 2010). The resulting SAM files were imported into Geneious (v6.1.6–7.0.3, Biomatters Ltd, Auckland, New Zealand; available from http://www.geneious.com), visually inspected, if necessary reassembled, and further trimmed (we allowed a 0.05 error probability limit and a maximum of 10 low quality bases at the 3′ end). The final consensus sequences for each individual and marker were constructed with a 50% threshold, where bases were called “N” if the Phred score was below 20. Sequence data has been deposited on GenBank under the accession numbers KP129679-KP131427 (see Table S2 for details) and KM263618-KM263752 (Santos et al., 2014). 2.3 Alignment and sequence characterization Sequences for each locus were aligned with the software MAFFT (v7.017) (Katoh and Standley, 2013), using the “—auto” option. Resulting alignments were visually inspected and manually improved when obvious sequencing artefacts (e.g. homopolymers) were observed or homology appeared questionable. Overall mean distance for each locus was calculated with the software MEGA (v5.2.1) (Tamura et al., 2011) as the total number of differences and the p-distance. This was done for all ingroup taxa (i.e. excluding Tylochromis polylepis), with pairwise deletion for missing and ambiguous data. For the concatenated alignment the within group mean distance was also calculated for the three most species-rich lineages, the Haplochromini, the Lamprologini and the Ectodini. 2.4 Gene tree discordance tests We first tested for topological incongruence between individual gene trees, using hierarchical likelihood ratio tests as implemented in the software CONCATERPILLAR (v1.7.2) (Leigh et al., 2008), with default settings and the assumption of linked branch lengths. As part of the CONCATERPILLAR analysis, tree inference was performed using RAxML (v7.2.8) (Stamatakis, 2006), assuming a single GTR substitution model for each sequence alignment. The two largest sets of markers identified by CONCATERPILLAR to have concordant histories (containing 13 and 14 markers, respectively) were each concatenated and subjected to phylogenetic analyses as described below. 2.5 Phylogenetic analysis of concatenated datasets In brief, sequence alignments for sets of loci were concatenated according to different strategies (see below) and phylogenetic analyses were based on both maximum likelihood with GARLI-PART (v2.0.1019) (Zwickl, 2006) and RAxML (v7.7) (Stamatakis, 2006), and on Bayesian inference with MrBayes v3.2.1 (Ronquist et al., 2012). Prior to tree inference, sequence alignments were subdivided according to gene region (exons, introns and UTRs) and codon position, and the optimal substitution models and partitioning schemes for these subdivisions were selected with the greedy algorithm of PartitionFinder (v1.1.1) (Lanfear et al., 2012) applying the Bayesian information criterion (BIC), and always taking into account substitution models available in the respective tree inference software (Schwarz, 1978). Phylogenetic analyses were run locally or at the CIPRES Science Gateway (Miller et al., 2010) and at Bioportal (Kumar et al., 2009). We first inferred the phylogeny for each of the two largest sets of loci with concordant histories according to CONCATERPILLAR. To this end, sequence alignments of all markers included in each set were concatenated. We then used concatenation of the full set of 42 loci to infer the phylogenetic history of LT cichlid fishes. This method assumes that all markers share a common evolutionary history and that discordant signals resulting from homoplasies can be counterbalanced by extensive and genome wide marker sampling (Rokas et al., 2003). While the assumption of a common evolutionary history seems to be violated at least for the analysis of the full marker set, concatenation may still lead to correct phylogenetic estimates when the true tree lies outside of the “anomaly zone” (Kubatko and Degnan, 2007). As there is no fully unlinked branch length option in GARLI, analyses were run with linked branch lengths (subsetspecificrates = 1, linkmodels = 0) and partitioning schemes and substitution models selected by PartitionFinder with respective settings (branchlengths = linked, models = all, resulting in 17 distinct partitions for the full-concatenated dataset). A total of 50 independent ML inferences were conducted in GARLI, with the termination condition set to at least 10,000 generations without any substantial (0.01) topological enhancement. Node support was assessed with 500 replicates of non-parametric bootstrapping with the same settings. Bootstrap values were mapped to the ML topology with SumTrees (v3.3.1), using the DendroPy Phylogenetic Computing Library (v3.12.0) (Sukumaran and Holder, 2010). ML phylogenies with unlinked partition-specific branch lengths were estimated with RAxML, using the -M option and applying a partitioning scheme obtained by a PartitionFinder analysis (settings: branchlengths = unlinked, model = raxml, resulting in 2 partitions). For the ML inference, we used RAxML’s rapid hill-climbing algorithm and the GTR + GAMMA model in 50 alternative runs and with 500 bootstrap replicates each. Likewise, MrBayes analyses were conducted with unlinked branch lengths (unlink brlens = (all), prset ratepr = fixed) and a partitioning scheme estimated by PartitionFinder (settings: branchlengths = unlinked, model = mrbayes, resulting in 2 partitions). Using the default prior probability distribution (exponential prior with a mean of 0.1) on branch lengths, two independent MrBayes runs were conducted with four chains for 10,000,000 MCMC generations, sampling every 100th generation, and discarding the first 25% as burn-in. All other settings were left at their defaults. Convergence of MCMC was assessed by MrBayes’ Potential Scale Reduction Factor (PSRF) reaching 1.0, and the average standard deviation of split frequencies falling below 0.01. We further evaluated effective sample sizes in Tracer (v1.5) (Rambaut and Drummond, 2007) and plotted posterior probabilities of splits over the MCMC run with AWTY online to test for convergence of runs (Nylander et al., 2008). To examine the phylogenetic signal contained in length-mutational events and to evaluate the potential power of a combined analysis (alignment plus indel information), the indels from the concatenated alignment were translated into a presence/absence matrix. This was performed with the software SeqState v1.4.1 (Müller, 2005) using the simple indel coding procedure (SIC) (Simmons and Ochoterena, 2000). Phylogenetic inference for these two datasets was conducted with GARLI, applying the Mkv model of Lewis (2001), and otherwise using default settings as described above. 2.6 Gene tree summary statistics and Bayesian concordance analysis In order to visualize potentially conflicting signal contained in the 42 loci, gene trees for each individual marker were inferred using GARLI with settings as specified in Section 2.5. The 50 best topologies from each run and from all 42 markers (a total of 2100 gene trees) were used to generate an average consensus tree in SplitsTree (v4.12.3) (Huson and Bryant, 2006). The implemented “average consensus tree” function constructs a neighbor-net using the average pairwise distances of the individual trees. As a further approach to investigate the discordance among the sampled gene trees and to combine conflicting data in a primary concordance and a population tree, we applied a Bayesian concordance analysis (BCA) (Ane et al., 2007; Baum, 2007), as implemented in the software BUCKy v1.4.0 (Larget et al., 2010). Using samples of MrBayes’ posterior tree distribution as input, this analysis accounts for both uncertainty in individual gene trees and potential discordance among trees inferred from different loci. The primary concordance tree, as estimated by BUCKy, visualizes the most dominant history from several gene trees, along with concordance factors (CF) indicating the proportion of loci supporting a given clade (Baum, 2007). In addition, a population tree with coalescent units as branch lengths is generated by BUCKy, based on quartets of concordance factors. This population tree is known to be consistent in the presence of incomplete lineage sorting (Chung and Ané, 2011; Larget et al., 2010). In order to apply BUCKy, MrBayes was used to infer gene trees from the individual loci, with substitution models and partitioning schemes selected by PartitionFinder (assuming linked branch lengths for all subdivisions of each locus). For each locus, we conducted two replicate MrBayes runs with six chains of 15 million generations, sampling every 100th generation. As reported by Willis et al. (2013), we found that for most loci, all of the 150,000 sampled trees represented unique topologies, suggesting a lack of resolution in some parts of the tree. This could partly be due to polytomies, which would be displayed as multiple weakly supported topologies with very short branches in MrBayes, as this software only provides fully resolved trees. To reduce the large number of distinct tree topologies, we pruned our dataset to 14 taxa, keeping only one representative per tribe (as our primary interest was a tribal level phylogeny). This deletion was done with the pruning option in BUCKy. The BUCKy analysis was conducted with 4 runs, 10 chains and 500,000 generations per chain. The alpha prior, which represents the a priori expected level of discordance, was set to 1–100. 2.7 Testing the strength of the phylogenetic signal as a function of dataset size In order to test whether our dataset contains a sufficiently large number of markers to recover the “true” phylogenetic history of LT cichlids, we randomly resampled and concatenated different numbers of markers, and produced ML phylogenies from these sets. We then measured the topological difference between the tree resulting from one set of randomly chosen markers and the tree resulting from the complete set including of all markers and between the trees resulting from two different and mutually exclusive marker sets. As our full dataset contained 42 markers, the first comparisons were done for 1–41 randomly chosen markers, whereas the latter was performed for 1–21 randomly chosen markers. For each number of markers between 1 and 41, we compiled 20 sets drawn at random from the full set of 42 markers. Then, for each of the sets containing at most 21 markers, a comparison set was produced containing the same number of markers so that the two sets did not share any marker. In order to take into account marker concordance according to the results of the CONCATERPILLAR analysis (see Section 2.4.) we repeated the same procedure for 1–13 markers, again with 20 replications each. For the latter analysis, we always compiled two sets of markers, so that markers shared a concordant history within each set, but a discordant history between the two sets (according to CONCATERPILLAR). All generated marker sets were subjected to phylogenetic analysis with GARLI (see above, Section 2.5.), using marker-specific partitions and substitution models as suggested by PartitionFinder. Topological differences between resulting ML trees were measured by means of their K-score (Soria-Carrasco et al., 2007), as the K-score accounts for variable substitution rates between marker sets. Then, K-scores of 20 replicate comparisons were plotted against the number of markers used in the datasets for which the respective ML trees had been inferred (see Camargo et al., 2012; Willis et al., 2013). We expected a general decrease of mean K-scores (i.e., fewer topological differences) with increasing marker number due to an increase in the phylogenetic signal for larger datasets. We further expected K-scores between a tree based on randomly drawn markers and the tree based on the full dataset of 42 markers to approach zero for marker numbers close to 42, as the alignments used for the reconstruction of the two trees would become increasingly similar. Nevertheless, we expected the degree to which K-scores decrease with increasing number of markers to inform about the minimum number of markers needed to reliably construct the relationships among cichlid tribes in LT. As an additional measure of discordance, we tested for statistically significant topological differences between the tree based on all 42 markers, and trees based on smaller datasets, using the Shimodaira–Hasegawa (Shimodaira and Hasegawa, 1999) and Approximated Unbiased (Shimodaira, 2002) tests as implemented in PAUP∗ (v.4.0a129) (Swofford, 2003). For each number of markers between 1 and 41, we plotted the number of tree replicates that fitted the full dataset significantly worse than the tree produced from all 42 markers. 3 Results 3.1 Sequencing Amplicon sequencing was successful for most of the 42 markers for the 45 taxa. In total, we obtained 98.3% of the 1890 possible sequences. Of 789,525 bp in the final alignment, 26,854 bp (3.40%) consisted of gaps; 27,211 bp (3.45%) were undetermined (“N”) and 476 bp (0.06%) were ambiguous (“WRYSMK” coded). 3.2 Alignment and sequence characterization The concatenated alignment had a total length of 17,545 bp, of which 1932 positions (11.01%) were variable and 769 positions (4.38%) were parsimony informative (not considering the outgroup Tylochromis polylepis). The amount of variable sites per marker varied between 13 and 110 sites (average: 46, median: 43), the number of parsimony informative sites ranged between four and 59 (average: 18.3, median: 16) (Table 2). The average sequence length for each marker was 417.7 bp (median: 423 bp), and the average total number of differences across all sequence pairs was 208.8 (uncorrected p-distance: 0.013). Within three of the major lineages, we found that the Ectodini showed the highest divergence (114.1 differences; uncorrected p-distance: 0.007), followed by the Lamprologini (110.4; 0.007) and the Haplochromini (all species included; 103.1; 0.006). Separate analyses of the within group mean distance of the haplochromines of the three lakes indicated a higher number of base differences between the four species of Lake Malawi (14.3; 0.0009) than the four species of Lake Victoria (6.8; 0.0004). The Tropheini (Ctenochromis horei, Lobochilotes labiatus, Gnathochromis pfefferi, Tropheus moori) included in this study showed a higher level of diversity (73.0; 0.004). 3.3 Gene tree discordance tests We used CONCATERPILLAR to test for topological incongruence between markers and to identify concordant sets of markers. Based on hierarchical likelihood ratio tests, CONCATERPILLAR detected six sets of markers that were concordant internally, but exhibited significant levels of discordance (p-value < 0.001) between them. The three largest sets contained 14, 13, and 6 markers, respectively, whereas the remaining three sets included 3 markers each (the assignment of each marker to one of these subsets is indicated in Table 2). The six sets exhibited no obvious clustering of markers according to gene function, coding and non-coding parts, or variability. The two largest sets of markers were subjected to individual phylogenetic analysis. Subset 1 (14 markers) contained a total of 5872 concatenated bp, of which 10.30% were variable and 3.92% were parsimony informative. The average pairwise distance was 61.05 mutational steps, and the uncorrected p-distance was 0.012. Subset 2 (13 markers) had a length of 5507 bp, with 12.69% variable sites, and 5.25% parsimony informative sites. This marker-set showed a somewhat higher variability (average pairwise distance: 76.07; uncorrected p-distance: 0.015). 3.4 Phylogenetic analysis of concatenated datasets Phylogenetic analysis of concatenated subsets revealed conflicting topologies between subset 1 and subset 2 (Fig. 2a and b). While the base of the resultant trees (i.e. the position of the Bathybatini, Boulengerochromini and Trematocarini) was highly similar, the topologies differed with respect to the relative placement of the Eretmodini, the Lamprologini, the Limnochromini and the Cyprichromini/Perissodini clade. For subset 1 the three inferred topologies from the different analyses were congruent. In these trees, the Lamprologini were nested within the mouthbrooding tribes of the ‘H-lineage’, of which the Cyprichromini/Perissodini clade branched off first. The Lamprologini were resolved as sister group to the Limnochromini in BI (BPP 0.81), and the same relationship was weakly supported in GARLI and RAxML inferences (BS 37 and 45). The Ectodini were placed as sister group to a clade formed by Cyphotilapiini, Eretmodini and the Haplochromini (GARLI BS 26, RAxML BS 35, BPP 0.89). The phylogenetic analyses of subset 2 revealed a monophyletic group containing the ‘H-lineage’ taxa (BS 99, BPP 1.0), which were placed as sister taxon to the Lamprologini. The Eretmodini branched off first, and the Ectodini were consistently grouped together with a clade formed by Cyprichromini/Perissodini, the Cyphotilapiini and the Limnochromini (BS 32-34, BPP 0.90). In general, the interrelationships of tribes received only moderate support, which is likely a consequence of the comparatively small number of markers in this subset (see Section 3.6). Excluding Eretmodus cyanostictus from these two phylogenetic analyses did not change the resulting tree topologies (data not shown). The trees obtained with the entire concatenated dataset of 42 markers were highly congruent and most nodes were very well supported (mean GARLI BS 79.2; mean RAxML BS 78.1; mean BPP 0.941). Fig. 3b depicts the ML tree inferred with GARLI; the ML tree obtained with RAxML and the 50% majority rule consensus tree of our MrBayes analysis are shown in Fig. S1. In all three trees, Oreochromis tanganicae appeared as the sister to Tilapia sparrmanii and a strongly supported clade formed by the remaining tribes (GARLI BS 100, RAxML BS, 100, BPP 1.0). The monophyly of these tribes was strongly supported (BS 100, BPP 1.0 for all tribes of which more than two representatives have been included). Within this group T. nigrifrons and B. graueri appeared as sister taxa (BS 100, BPP 1.0) in all our analyses. The three tribes Boulengerochromini (represented by their only member, B. microlepis), Trematocarini (represented by T. nigrifrons), and Bathybatini (represented by B. graueri) appeared outside of a strongly supported clade (BS 100, BPP 1.0), in which the substrate spawning Lamprologini, the most species-rich tribe within LT, are clearly separated from the mouthbrooding tribes (i.e. Cyphotilapiini, Cyprichromini, Ectodini, Eretmodini, Haplochromini, Limnochromini, Perissodini; BS 73-75, BPP 1.0). The branching order within the mouthbrooding tribes of the ‘H-lineage’ received less support, and there was incongruence between the tree topologies resulting from the different analyses with respect to the placement of the Cyphotilapiini and the Limnochromini relative to each other, and regarding the first divergence events within the Haplochromini (indicated by dotted lines in Fig. 3b). The Cyprichromini were consistently resolved as the sister group of Perissodini (BS 100, BPP 1.0), and the clade formed by these two tribes represented the sister of all remaining tribes of the ‘H-lineage’ in all analyses of the full-concatenated dataset. The Limnochromini and the Cyphotilapiini formed a monophyletic group that was sister to a clade combining the Ectodini, the Eretmodini, and the Haplochromini (GARLI BS 65, RAxML BS 59, BPP 1.00) in the GARLI analysis, whereas the Cyphotilapiini appeared closer to this clade according to the RAxML and MrBayes analyses. Within this clade, the representative of the Eretmodini (E. cyanostictus) was consistently placed as sister group to the Haplochromini (GARLI BS 71, RAxML BS 50, BPP 0.88). Similarly, the species from Lake Victoria and Lake Malawi appeared reciprocally monophyletic (BS 100, BPP 1.0) within the Haplochromini. Haplochromis cf. stappersii from LT was resolved as sister taxon to the Lake Victoria cichlids (BS 100, BPP 1.0). The riverine species Astatotilapia burtoni was always placed outside of the species-flocks of the Lake Malawi and Victoria cichlids (BS 100, BPP 1.0). The haplochromines Serranochromis macrocephalus and Pseudocrenilabrus philander were either put into a separate clade (in RAxML and BI), or placed together with the LT haplochromines (Tropheini) (with GARLI). Translating all indels of the 42 loci into a binary code resulted in a dataset comprising 167 positions, of which 70 were parsimony informative. A phylogenetic hypothesis obtained with this dataset with GARLI was, overall, concordant with the trees resulting from the concatenated dataset. However, while the monophyly of most tribes and the position of the Eretmodini as sister group to the Haplochromini was recovered, the respective support values were generally low and the position of most of the tribes relative to each other could not be recovered (see Fig. S2). 3.5 Gene tree summary statistics and Bayesian concordance analysis Inferring single gene trees from 42 genes and 45 taxa with both GARLI and MrBayes (data not shown) resulted in 42 alternative topologies with some to numerous polytomies or low support values for certain branches, whereas other parts of the trees were well resolved. Fig. 4 shows the average consensus network of 2100 trees with 168 splits representing the conflicting affinities within the individual gene trees at the base of the tribes. The tribes themselves seem clearly defined and show only few alternative splits. For the Bayesian concordance analysis with BUCKy, we pruned the dataset to one representative per tribe (Fig. 5). Changes in the alpha prior had no influence in the topology of both primary concordance and population tree. Its topology (with alpha default prior) is mostly consistent with the species tree inferred from the full-concatenated dataset (see above; Fig. 3). However, one topological disagreement was found regarding the position of Boulengerochromis microlepis, which was placed as a sister group to the clade composed of the Lamprologini and the representatives of the ‘H-lineage’ (including the Eretmodini) in the population tree, but clustered with the Trematocarini and the Bathybatini in the primary concordance tree. Within the population tree the Eretmodini were again resolved as sister group to the Haplochromini. This close relationship is also reflected in the concordance factors of splits within the primary concordance tree (see Text S1). 3.6 Strength of the phylogenetic signal as a function of dataset size After 20 repetitions of random resampling and concatenation of 1–41 markers, we used GARLI to infer ML phylogenies from all replicate marker sets, and compared the resulting trees between each other and with the optimal tree based on the full concatenated dataset of 42 markers, in order to test the strength of the phylogenetic signal as a function of dataset size. We expected topological differences between two trees to decrease with increasing size of the respective marker sets as shown in Camargo et al. (2012). Different types of comparisons were performed: Between one tree based on 1–41 markers and the tree resulting from the full marker set (Fig. 6a), between two trees produced from mutually exclusive sets containing 1–21 markers (Fig. 6b), and between two trees based on mutually exclusive sets of 1–13 markers found to be internally concordant but externally discordant in topology according to the CONCATERPILLAR analysis (Fig. 6c). As expected, topological differences between two trees, as measured by their K-score, generally decreased with increasing marker number; the steepest decrease was observed for marker numbers between 1 and 8–10. The median K-score between one tree based on a randomly compiled marker set of a given size and the tree based on the full set of 42 markers was always lower than median K-scores between two trees based on randomly compiled marker sets of the same size (Fig. 6a versus b). Furthermore, topological comparisons involving the tree based on the full marker set generally resulted in a lower variance of K-scores than comparisons between two trees that were produced from randomly sampled mutually exclusive marker sets. In the latter case, the two trees represent independent phylogenetic estimates and are thus particularly useful to assess variance in discordance as a function of marker set size. For this type of comparisons, K-scores appear relatively constant for datasets combining between 11 and 21 markers. Nevertheless, K-scores between trees based on 21 markers (mean 0.0111) are significantly lower than those between trees constructed from sets of 16 markers (mean 0.0140, t-test p-value = 0.01613) or less (means ⩾ 0.0128, t-test p-values ⩽ 0.01704). For most marker set sizes, mean and median K-scores of two trees based on mutually exclusive marker sets were slightly lower when all markers with a set were concordant according to the CONCATERPILLAR analysis (Fig. 6c) compared to when sets were composed of randomly sampled markers (Fig. 6b). This reduction was significant for marker sets with eight markers or more (t-test p-values ⩽ 0.0295), with the exception of sets containing eleven markers (t-test p-value = 0.0881), which suggests that the discordance between the two largest marker sets identified by CONCATERPILLAR is lower than that between randomly compiled marker sets of the same size. Similarly, the number of marker set replicates, for which ML trees differ significantly from the ML tree based on 42 markers, shows an overall decrease with increasing size of the respective marker sets. For concatenated sets of 1–5 markers, and for sets of 8 markers, phylogenies produced from all 20 replicate sets are significantly different to the full ML tree, according to both the SH and the AU tests. On the other hand, for concatenated sets of 34 or more markers, none of the phylogenies based on these sets differ significantly from the tree obtained with the full set of markers, according to either of the two tests. Between these extremes, we observe a general decrease in the number of rejected tree replicates with increasing number of markers, based on which these trees were produced (Fig. 6a). 4 Discussion The present study is the most extensive phylogenetic analysis of cichlid fishes in East African Lake Tanganyika with respect to the number of nuclear DNA markers and the total length of the ncDNA sequences analyzed. The main goal of our work was to establish a robust phylogenetic hypothesis for the relationships among the cichlid tribes of LT, which has so far been inferred on the basis of mtDNA or relatively few nuclear markers only (Clabaut et al., 2005; Day et al., 2008; Friedman et al., 2013; Kocher et al., 1995; Muschick et al., 2012; Salzburger et al., 2002a; Sturmbauer and Meyer, 1993). The comparatively high information content provided by mtDNA sequences and the availability of universal primers were the main reasons for the utilization of mtDNA markers in earlier phylogenetic analyses aiming to resolve the relatively young and rapid radiation of cichlid fishes in LT. Among the many drawbacks of mtDNA markers are that only maternal inheritance patterns are captured and that past events of introgression and hybridization remain largely invisible (Ballard and Whitlock, 2004). In addition, a single locus (irrespective of being based on mtDNA or ncDNA) might not accurately reflect the species tree, as individual gene trees often differ from the true species tree (Pamilo and Nei, 1988). Nuclear DNA markers, on the other hand, usually contain fewer variable sites thus less phylogenetic signal. Clabaut et al. (2005) showed, for example, that in LT cichlids, ncDNA datasets would need to contain about ten times more sequence data to obtain the same quantity of phylogenetic information as provided by mtDNA markers – a task not reached by any previous study. Here we took advantage of the 454 next-generation pyrosequencing technology and compiled a ncDNA dataset for LT cichlids containing 42 markers in well characterized genes and reaching a total alignment length of 17,545 bp. We chose a locus re-sequencing strategy with barcoded primers in order to obtain long enough sequence reads and to sample a large number of gene histories. Primers were chosen to bind in more conserved exons and to amplify (if possible) more variable intron regions (Meyer and Salzburger, 2012). 4.1 Single gene-tree discordance and evaluation of the strength of the phylogenetic signal Not surprisingly, the individual single locus datasets did not contain enough phylogenetic information to accurately resolve the phylogenetic relationships among the cichlid tribes of LT. Most single locus trees were not very well resolved, the branch support values in these trees were generally rather low, and all 42 single locus topologies differed at least to some extent (in part because of the occurrence of polytomies; not shown). Overall, however, many of the single locus topologies follow a general trend as is illustrated in the average consensus network shown in Fig. 4. Many branches, and especially the monophyly of cichlid tribes, are well supported across the datasets. However, the consensus network indicates certain areas of uncertainties, which might result from hybridization and/or incomplete lineage sorting or simply reflect the low power of resolution in some of the individual markers (see below). In order to estimate the strength of the phylogenetic signal as a function of dataset size and to evaluate whether our dataset contained enough phylogenetic information, we applied a strategy that compares tree topologies inferred from randomly chosen datasets with varying numbers of markers per alignment on the basis of their K-scores (Camargo et al., 2012). More specifically, we compiled datasets from 1 to 41 randomly chosen markers (in 20 replications each) and compared the ML trees based on these marker sets to the tree produced in the same way from the full dataset containing all 42 concatenated markers. Obviously, and as expected, the topologies resulting from the randomly drawn marker sets become increasingly similar to the best tree obtained with 42 markers the more markers are included in each concatenated dataset (Fig. 6a). Also, differences between equally large and mutually exclusive marker sets generally decrease with increases in the number of markers included in both sets (Fig. 6b). The same decrease was observed when trees were produced from two sets of markers that were identified as topologically concordant within each set, but discordant between sets (Fig. 6c). However, topological differences were generally slightly lower when marker sets were discordant to each other (Fig. 6c). This was unexpected but could in part be explained if the phylogenetic histories of marker sets 3–6 (which are included in Fig. 6b, but excluded from Fig. 6c) are even more discordant than those of marker sets 1 and 2. Importantly, while all tree topologies resulting from datasets of 1–5 markers were significantly distinct from the best tree according to both SH and AU tests, inferred trees become successively more similar with an increasing number of markers, and statistically indifferent from the best tree when more than 34 markers are included (light blue lines in Fig. 6a). These results suggest that our full dataset is large enough to reliably resolve the phylogenetic history of the LT cichlid fishes. Whether or not an extension of our marker set to even more than 42 markers would provide additional phylogenetic signal remains to be tested. 4.2 A threefold strategy for phylogenetic analyses in LT cichlids In order to account for potential problems with dataset concatenation (see below), we opted to apply three strategies to analyze our data. In a first step, we performed ML and BI phylogenetic analyses with a concatenated dataset containing all 42 markers of all 45 species. These analyses were based of the naïve assumptions that all gene histories equally reflect the species tree, and that the ‘true’ phylogenetic signal should dominate over phylogenetic noise in a large enough dataset (Rokas et al., 2003). The usage of the concatenated dataset is further backed up by our phylogenetic analyses of randomly chosen subsets of varying numbers of markers, which demonstrate that the phylogenetic signal improves with increasing number of included markers (Fig. 6). Although concatenation of multiple markers is often thought to improve accuracy (Bayzid and Warnow, 2013; Chen and Li, 2001; Rokas et al., 2003; but see Salichos and Rokas, 2013), this approach assumes that genes share a common evolutionary history, and it has been shown that violation of this assumption can lead to strongly supported yet incorrect phylogenies (Degnan and Rosenberg, 2009; Gadagkar et al., 2005; Kubatko and Degnan, 2007; Salichos and Rokas, 2013). One situation, in which concatenation may lead to inconsistent species tree estimates, is incomplete lineage sorting (Degnan and Rosenberg, 2009; Kubatko and Degnan, 2007; Yang and Rannala, 2012). We thus, in a second approach, applied a gene tree discordance test with CONCATERPILLAR to evaluate the incongruence between individual gene trees. This test suggested the existence of six sets of markers that were concordant within them, but discordant between each other. The two largest sets, containing 14 and 13 markers respectively, were then subjected to in-depth phylogenetic analysis. As a third strategy, we performed a Bayesian concordance analysis with BUCKy, which accounts for uncertainty and variability in the individual locus phylogenies and has been shown to deal well with incomplete lineage sorting (Chung and Ané, 2011; Knowles and Kubatko, 2011; Yang and Warnow, 2011). In this analysis, we pruned our dataset to one species per tribe. Overall, the three strategies applied to analyze our multi-marker dataset resulted in congruent topologies. All analyses confirm the monophyly of the LT tribes (in cases where more than one representative was included; this does, hence, not apply to the BUCKy analysis with the reduced taxon set). In all analyses, the Tylochromini, Oreochromini and Tilapiini were resolved outside of all other included species. The representatives of the Trematocarini and the Bathybatini always formed a clade, and were, together with B. microlepis (Boulengerochromini), consistently placed as sister-group to the remaining cichlid tribes; the Cyprichromini and Perissodini always clustered together. Furthermore, in all analyses except in those based on subset 1 of CONCATERPILLAR, the Lamprologini were resolved as sister group to the ‘H-linage’ consisting of Cyphotilapiini, Limnochromini, Cyprichromini, Perissodini, Ectodini, Eretmodini and Haplochromini. In all analyses, the Eretmodini appear as a member of the ‘H-lineage’ and, with one exception (i.e. subset 2 of CONCATERPILLAR), appear as sister-group to the Haplochromini. Within the ‘H-lineage’, the relationships of the cichlid tribes differed between the three approaches. Especially the analysis of subset 1 of CONCATERPILLAR revealed a rather different topology, whereas in subset 2 the relative position of the Eretmodini and Ectodini varied in comparison to the other approaches. Note, however, that the two largest subsets of markers identified by CONCATERPILLAR contain only 14 (subset 1) and 13 markers (subset 2), respectively. Our analyses have shown that sets with as many as 34 markers can still produce significantly different trees for the same set of taxa. The phylogenetic hypotheses resulting from these small marker sets (Fig. 2a and b) should thus be taken with caution. Taken together, we believe that, in our case, the concatenation of all markers is a justified strategy (Fig. 3), as it leads to the best-supported tree topologies, which are backed-up by similar results in both the average consensus network (Fig. 4) and the Bayesian concordance analysis (Fig. 5). The concatenation strategy is further supported by our phylogenetic signal tests, which show that the largest datasets lead to significantly more robust topologies (Fig. 6), whereas the subsets suggested by CONCATERPILLAR may not contain enough phylogenetic information. At the same time, these tests indicate the presence of a sufficient phylogenetic signal in the concatenated dataset, so that remaining uncertainties in the resultant tree topologies (GARLI, RAxML and MrBayes analyses of concatenated dataset and subsets) should not be due to lacking power of resolution (‘soft polytomy’ problem). Instead, it appears that the remaining uncertainties in our trees, most notably the phylogenetic relationships among ‘H-lineage’ tribes (see Figs. 2–4), are due to high speciation rates at the onset of radiation of the LT mouthbrooders (‘hard polytomy’ problem), past events of hybridization, and/or the persistence of ancestral polymorphisms. It has previously been recognized that it is notoriously difficult to resolve, with the available methodology, the phylogenetic relationships among lineages that emerged from adaptive radiation events (Glor, 2010), which is not least due to the fact that such tree topologies are expected to be ‘bottom-heavy’ (Gavrilets and Vose, 2005). 4.3 Conclusions With this study, we present a novel hypothesis for the phylogenetic relationships among East African cichlid tribes, which is based on the largest set of ncDNA sequences so far, and which differs from all previous hypotheses (Fig. 1). Our analyses provide strong support for the monophyly of LT mouthbrooding cichlids (i.e. the ‘H-lineage’ of Nishida, 1991) as sister-group to the substrate spawning Lamprologini. We thus confirm the scenario that both lineages have radiated in parallel within LT (Salzburger and Meyer, 2004), leading to some intriguing cases of convergent evolution (Muschick et al., 2012). The clustering of the tribes within the ‘H-lineage’ generally reflects the life styles and habitat use of the respective tribes. The Cyprichromini and Perissodini, which are consistently put together (Figs. 2–5), are both adapted to the open-water column; the Cyphotilapiini and Limnochromini, which cluster together in most analyses (Figs. 2–5, excluding 2A), are restricted to deep-water habitats; and the Ectodini, Eretmodini and Haplochromini dominate (together with many lamprologine species) the shallow waters of LT. Our phylogenies thus reveal the general trend that the less species-rich cichlid tribes in LT (including the Bathybatini, Boulengerochromini and Trematocarini) occupy less-productive habitats such as the open-water column or deeper areas, whereas the generally more species-rich tribes of the ‘H-lineage’ dominate the more-productive and generally preferred shallow/rocky habitats (Muschick et al., 2012). We further postulate a nested position of the Eretmodini within the ‘H-lineage’, as sister-group to the Haplochromini, which is in clear contrast to most of the studies relying on mtDNA markers (Clabaut et al., 2005; Day et al., 2008; Kocher et al., 1995; Muschick et al., 2012), yet in concordance to allozyme data (Nishida, 1991) and ncDNA phylogenies (Friedman et al., 2013). The obvious discordance between the Lamprologini-like mtDNA and Haplochromini-like ncDNA in the Eretmodini can either be explained by incomplete mtDNA lineage sorting, or, more likely, by an ancient hybridization event (Meng and Kubatko, 2009). The positions of the oldest tribes (Tylochromini, Oreochromini, Trematocarini, Bathybatini, Boulengerochromini) are largely in agreement with previous studies, as most studies suggested a sister-group relationship between the Bathybatini and Trematocarini (Clabaut et al., 2005; Day et al., 2008; Salzburger et al., 2002a) and placed the Oreochromini outside of this group (Friedman et al., 2013; Muschick et al., 2012; Salzburger et al., 2002a). The placement of the Boulengerochromini differed slightly between our analyses, but in all cases this monotypic tribe was resolved outside the clade formed by the Lamprologini and the ‘H-lineage’. 5 Outlook With this study, we provide a strong phylogenetic hypothesis for the cichlid tribes in LT based on 42 ncDNA makers. Yet, we also identified remaining areas of uncertainties, especially with respect to the phylogenetic relationships of the mouthbrooding tribes within the ‘H-lineage’. Future analyses should focus on the amount and relative proportion of shared genes among the different cichlid lineages to allow further insights into stochastic processes such as incomplete lineage sorting or hybridization. To this end, we recommend the usage of much larger datasets such as whole transcriptomes or genomes. RAD-sequencing could also provide a large random sample of ncDNA loci, although the current read lengths render the phylogenetic inference based on individual loci problematic. Another important next step to understand the evolutionary history of LT cichlids and to establish a species tree would be to perform coalescent-based analysis with BEST and ∗BEAST (Liu, 2008; Heled and Drummond, 2010), using phased alleles and more individuals per species. Finally, future analyses should increase taxon sampling, ultimately leading to a complete species tree for the cichlid species of LT. Data accessibility All sequences are accessible in Genbank KP129679-KP131427 and KM263618-KM263752. Trees are deposited at Treebase (http://purl.org/phylo/treebase/phylows/study/TB2:S16660).
                Bookmark

                Author and article information

                Contributors
                rahmouni.chahrazed@gmail.com
                maarten.vanhove@kuleuven.be
                simkova@sci.muni.cz
                Journal
                Parasit Vectors
                Parasit Vectors
                Parasites & Vectors
                BioMed Central (London )
                1756-3305
                2 December 2017
                2 December 2017
                2017
                : 10
                : 591
                Affiliations
                [1 ]ISNI 0000 0001 2194 0956, GRID grid.10267.32, Department of Botany and Zoology, Faculty of Science, , Masaryk University, ; Kotlářská 2, CZ-611 37 Brno, Czech Republic
                [2 ]ISNI 0000 0001 2171 9581, GRID grid.20478.39, Capacities for Biodiversity and Sustainable Development (CEBioS), Operational Directorate Natural Environment, , Royal Belgian Institute of Natural Sciences, ; Vautierstraat 29, B-1000 Brussels, Belgium
                [3 ]ISNI 0000 0001 0668 7884, GRID grid.5596.f, Laboratory of Biodiversity and Evolutionary Genomics, Department of Biology, , University of Leuven, ; Charles Deberiotstraat 32, B-3000 Leuven, Belgium
                [4 ]ISNI 0000 0001 0604 5662, GRID grid.12155.32, Centre for Environmental Sciences, Research Group Zoology: Biodiversity & Toxicology, , Hasselt University, ; Agoralaan Gebouw D, B-3590 Diepenbeek, Belgium
                Article
                2460
                10.1186/s13071-017-2460-6
                5712084
                29197419
                f8b92d95-7690-4565-a0f3-d3ee74718d35
                © The Author(s). 2017

                Open AccessThis article is distributed under the terms of the Creative Commons Attribution 4.0 International License ( http://creativecommons.org/licenses/by/4.0/), which permits unrestricted use, distribution, and reproduction in any medium, provided you give appropriate credit to the original author(s) and the source, provide a link to the Creative Commons license, and indicate if changes were made. The Creative Commons Public Domain Dedication waiver ( http://creativecommons.org/publicdomain/zero/1.0/) applies to the data made available in this article, unless otherwise stated.

                History
                : 16 November 2016
                : 9 October 2017
                Funding
                Funded by: Czech Science Foundation
                Award ID: P505/12/G112
                Categories
                Research
                Custom metadata
                © The Author(s) 2017

                Parasitology
                africa,burundi,cichlidae,cyprichromini,ectodini,eretmodini,platyhelminthes,monogenea,cichlidogyrus
                Parasitology
                africa, burundi, cichlidae, cyprichromini, ectodini, eretmodini, platyhelminthes, monogenea, cichlidogyrus

                Comments

                Comment on this article