75
views
0
recommends
+1 Recommend
1 collections
    0
    shares
      • Record: found
      • Abstract: found
      • Article: found
      Is Open Access

      You Are What You Tweet: Connecting the Geographic Variation in America’s Obesity Rate to Twitter Content

      research-article
      * , ,
      PLoS ONE
      Public Library of Science

      Read this article at

      Bookmark
          There is no author summary for this article yet. Authors can add summaries to their articles on ScienceOpen to make them more accessible to a non-specialist audience.

          Abstract

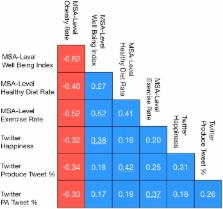
          We conduct a detailed investigation of the relationship among the obesity rate of urban areas and expressions of happiness, diet and physical activity on social media. We do so by analyzing a massive, geo-tagged data set comprising over 200 million words generated over the course of 2012 and 2013 on the social network service Twitter. Among many results, we show that areas with lower obesity rates: (1) have happier tweets and frequently discuss (2) food, particularly fruits and vegetables, and (3) physical activities of any intensity. Additionally, we provide evidence that each of these results offer different and unique insight into the variation of the obesity rate in urban areas within the United States. Our work shows how the contents of social media may potentially be used to estimate real-time, population-scale measures of factors related to obesity.

          Related collections

          Most cited references18

          • Record: found
          • Abstract: found
          • Article: not found

          Physical Activity and Public Health: Updated Recommendation for Adults From the American College of Sports Medicine and the American Heart Association

          In 1995 the American College of Sports Medicine and the Centers for Disease Control and Prevention published national guidelines on Physical Activity and Public Health. The Committee on Exercise and Cardiac Rehabilitation of the American Heart Association endorsed and supported these recommendations. The purpose of the present report is to update and clarify the 1995 recommendations on the types and amounts of physical activity needed by healthy adults to improve and maintain health. Development of this document was by an expert panel of scientists, including physicians, epidemiologists, exercise scientists, and public health specialists. This panel reviewed advances in pertinent physiologic, epidemiologic, and clinical scientific data, including primary research articles and reviews published since the original recommendation was issued in 1995. Issues considered by the panel included new scientific evidence relating physical activity to health, physical activity recommendations by various organizations in the interim, and communications issues. Key points related to updating the physical activity recommendation were outlined and writing groups were formed. A draft manuscript was prepared and circulated for review to the expert panel as well as to outside experts. Comments were integrated into the final recommendation. To promote and maintain health, all healthy adults aged 18 to 65 yr need moderate-intensity aerobic (endurance) physical activity for a minimum of 30 min on five days each week or vigorous-intensity aerobic physical activity for a minimum of 20 min on three days each week. [I (A)] Combinations of moderate- and vigorous-intensity activity can be performed to meet this recommendation. [IIa (B)] For example, a person can meet the recommendation by walking briskly for 30 min twice during the week and then jogging for 20 min on two other days. Moderate-intensity aerobic activity, which is generally equivalent to a brisk walk and noticeably accelerates the heart rate, can be accumulated toward the 30-min minimum by performing bouts each lasting 10 or more minutes. [I (B)] Vigorous-intensity activity is exemplified by jogging, and causes rapid breathing and a substantial increase in heart rate. In addition, every adult should perform activities that maintain or increase muscular strength and endurance a minimum of two days each week. [IIa (A)] Because of the dose-response relation between physical activity and health, persons who wish to further improve their personal fitness, reduce their risk for chronic diseases and disabilities or prevent unhealthy weight gain may benefit by exceeding the minimum recommended amounts of physical activity. [I (A)]
            Bookmark
            • Record: found
            • Abstract: found
            • Article: not found

            The medical care costs of obesity: an instrumental variables approach.

            This paper is the first to use the method of instrumental variables (IV) to estimate the impact of obesity on medical costs in order to address the endogeneity of weight and to reduce the bias from reporting error in weight. Models are estimated using restricted-use data from the Medical Expenditure Panel Survey for 2000-2005. The IV model, which exploits genetic variation in weight as a natural experiment, yields estimates of the impact of obesity on medical costs that are considerably higher than the estimates reported in the previous literature. For example, obesity is associated with $656 higher annual medical care costs, but the IV results indicate that obesity raises annual medical costs by $2741 (in 2005 dollars). These results imply that the previous literature has underestimated the medical costs of obesity, resulting in underestimates of the economic rationale for government intervention to reduce obesity-related externalities. Copyright © 2011 Elsevier B.V. All rights reserved.
              Bookmark
              • Record: found
              • Abstract: found
              • Article: found
              Is Open Access

              National and Local Influenza Surveillance through Twitter: An Analysis of the 2012-2013 Influenza Epidemic

              Social media have been proposed as a data source for influenza surveillance because they have the potential to offer real-time access to millions of short, geographically localized messages containing information regarding personal well-being. However, accuracy of social media surveillance systems declines with media attention because media attention increases “chatter” – messages that are about influenza but that do not pertain to an actual infection – masking signs of true influenza prevalence. This paper summarizes our recently developed influenza infection detection algorithm that automatically distinguishes relevant tweets from other chatter, and we describe our current influenza surveillance system which was actively deployed during the full 2012-2013 influenza season. Our objective was to analyze the performance of this system during the most recent 2012–2013 influenza season and to analyze the performance at multiple levels of geographic granularity, unlike past studies that focused on national or regional surveillance. Our system’s influenza prevalence estimates were strongly correlated with surveillance data from the Centers for Disease Control and Prevention for the United States (r = 0.93, p < 0.001) as well as surveillance data from the Department of Health and Mental Hygiene of New York City (r = 0.88, p < 0.001). Our system detected the weekly change in direction (increasing or decreasing) of influenza prevalence with 85% accuracy, a nearly twofold increase over a simpler model, demonstrating the utility of explicitly distinguishing infection tweets from other chatter.
                Bookmark

                Author and article information

                Contributors
                Role: Editor
                Journal
                PLoS One
                PLoS ONE
                plos
                plosone
                PLoS ONE
                Public Library of Science (San Francisco, CA USA )
                1932-6203
                2015
                2 September 2015
                : 10
                : 9
                : e0133505
                Affiliations
                [001]Virginia Modeling, Analysis and Simulation Center, Old Dominion University, Norfolk, VA, United States of America
                McMaster University, CANADA
                Author notes

                Competing Interests: The authors have declared that no competing interests exist.

                Conceived and designed the experiments: RJG SD JP. Performed the experiments: RJG. Analyzed the data: RJG. Contributed reagents/materials/analysis tools: RJG. Wrote the paper: RJG SD JP.

                Article
                PONE-D-15-02269
                10.1371/journal.pone.0133505
                4557976
                26332588
                0bd1c375-f391-4a75-9a1d-daeda74accaf
                Copyright @ 2015

                This is an open access article distributed under the terms of the Creative Commons Attribution License, which permits unrestricted use, distribution, and reproduction in any medium, provided the original author and source are credited

                History
                : 16 January 2015
                : 3 June 2015
                Page count
                Figures: 6, Tables: 2, Pages: 16
                Funding
                The authors have no support or funding to report.
                Categories
                Research Article
                Custom metadata
                All relevant data are within the manuscript and its Supporting Information files.

                Uncategorized
                Uncategorized

                Comments

                Comment on this article