30
views
0
recommends
+1 Recommend
1 collections
    0
    shares
      • Record: found
      • Abstract: found
      • Article: not found

      Mathematical modeling of the spread of the coronavirus disease 2019 (COVID-19) taking into account the undetected infections. The case of China

      research-article

      Read this article at

      ScienceOpenPublisherPMC
      Bookmark
          There is no author summary for this article yet. Authors can add summaries to their articles on ScienceOpen to make them more accessible to a non-specialist audience.

          Highlights

          • Mathematical model for coronavirus disease that fits well the spread in China

          • New θ-SEIHRD model taking into account undetected infections

          • Validation of the model with the reported data on China

          • Estimation of errors when identifying parameters at early stages of the pandemic

          • Different scenarios to show the impact of undetected cases on the pandemic

          Abstract

          In this paper we develop a mathematical model for the spread of the coronavirus disease 2019 (COVID-19). It is a new θ-SEIHRD model (not a SIR, SEIR or other general purpose model), which takes into account the known special characteristics of this disease, as the existence of infectious undetected cases and the different sanitary and infectiousness conditions of hospitalized people. In particular, it includes a novel approach that considers the fraction θ of detected cases over the real total infected cases, which allows to study the importance of this ratio on the impact of COVID-19. The model is also able to estimate the needs of beds in hospitals. It is complex enough to capture the most important effects, but also simple enough to allow an affordable identification of its parameters, using the data that authorities report on this pandemic.

          We study the particular case of China (including Chinese Mainland, Macao, Hong-Kong and Taiwan, as done by the World Health Organization in its reports on COVID-19), the country spreading the disease, and use its reported data to identify the model parameters, which can be of interest for estimating the spread of COVID-19 in other countries. We show a good agreement between the reported data and the estimations given by our model. We also study the behavior of the outputs returned by our model when considering incomplete reported data (by truncating them at some dates before and after the peak of daily reported cases). By comparing those results, we can estimate the error produced by the model when identifying the parameters at early stages of the pandemic. Finally, taking into account the advantages of the novelties introduced by our model, we study different scenarios to show how different values of the percentage of detected cases would have changed the global magnitude of COVID-19 in China, which can be of interest for policy makers.

          Related collections

          Most cited references24

          • Record: found
          • Abstract: found
          • Article: not found

          A novel coronavirus outbreak of global health concern

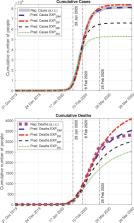
          In December, 2019, Wuhan, Hubei province, China, became the centre of an outbreak of pneumonia of unknown cause, which raised intense attention not only within China but internationally. Chinese health authorities did an immediate investigation to characterise and control the disease, including isolation of people suspected to have the disease, close monitoring of contacts, epidemiological and clinical data collection from patients, and development of diagnostic and treatment procedures. By Jan 7, 2020, Chinese scientists had isolated a novel coronavirus (CoV) from patients in Wuhan. The genetic sequence of the 2019 novel coronavirus (2019-nCoV) enabled the rapid development of point-of-care real-time RT-PCR diagnostic tests specific for 2019-nCoV (based on full genome sequence data on the Global Initiative on Sharing All Influenza Data [GISAID] platform). Cases of 2019-nCoV are no longer limited to Wuhan. Nine exported cases of 2019-nCoV infection have been reported in Thailand, Japan, Korea, the USA, Vietnam, and Singapore to date, and further dissemination through air travel is likely.1, 2, 3, 4, 5 As of Jan 23, 2020, confirmed cases were consecutively reported in 32 provinces, municipalities, and special administrative regions in China, including Hong Kong, Macau, and Taiwan. 3 These cases detected outside Wuhan, together with the detection of infection in at least one household cluster—reported by Jasper Fuk-Woo Chan and colleagues 6 in The Lancet—and the recently documented infections in health-care workers caring for patients with 2019-nCoV indicate human-to-human transmission and thus the risk of much wider spread of the disease. As of Jan 23, 2020, a total of 835 cases with laboratory-confirmed 2019-nCoV infection have been detected in China, of whom 25 have died and 93% remain in hospital (figure ). 3 Figure Timeline of early stages of 2019-nCoV outbreak 2019-nCoV=2019 novel coronavirus. In The Lancet, Chaolin Huang and colleagues 7 report clinical features of the first 41 patients admitted to the designated hospital in Wuhan who were confirmed to be infected with 2019-nCoV by Jan 2, 2020. The study findings provide first-hand data about severity of the emerging 2019-nCoV infection. Symptoms resulting from 2019-nCoV infection at the prodromal phase, including fever, dry cough, and malaise, are non-specific. Unlike human coronavirus infections, upper respiratory symptoms are notably infrequent. Intestinal presentations observed with SARS also appear to be uncommon, although two of six cases reported by Chan and colleagues had diarrhoea. 6 Common laboratory findings on admission to hospital include lymphopenia and bilateral ground-glass opacity or consolidation in chest CT scans. These clinical presentations confounded early detection of infected cases, especially against a background of ongoing influenza and circulation of other respiratory viruses. Exposure history to the Huanan Seafood Wholesale market served as an important clue at the early stage, yet its value has decreased as more secondary and tertiary cases have appeared. Of the 41 patients in this cohort, 22 (55%) developed severe dyspnoea and 13 (32%) required admission to an intensive care unit, and six died. 7 Hence, the case-fatality proportion in this cohort is approximately 14·6%, and the overall case fatality proportion appears to be closer to 3% (table ). However, both of these estimates should be treated with great caution because not all patients have concluded their illness (ie, recovered or died) and the true number of infections and full disease spectrum are unknown. Importantly, in emerging viral infection outbreaks the case-fatality ratio is often overestimated in the early stages because case detection is highly biased towards the more severe cases. As further data on the spectrum of mild or asymptomatic infection becomes available, one case of which was documented by Chan and colleagues, 6 the case-fatality ratio is likely to decrease. Nevertheless, the 1918 influenza pandemic is estimated to have had a case-fatality ratio of less than 5% 13 but had an enormous impact due to widespread transmission, so there is no room for complacency. Table Characteristics of patients who have been infected with 2019-nCoV, MERS-CoV, and SARS-CoV7, 8, 10, 11, 12 2019-nCoV * MERS-CoV SARS-CoV Demographic Date December, 2019 June, 2012 November, 2002 Location of first detection Wuhan, China Jeddah, Saudi Arabia Guangdong, China Age, years (range) 49 (21–76) 56 (14–94) 39·9 (1–91) Male:female sex ratio 2·7:1 3·3:1 1:1·25 Confirmed cases 835† 2494 8096 Mortality 25† (2·9%) 858 (37%) 744 (10%) Health-care workers 16‡ 9·8% 23·1% Symptoms Fever 40 (98%) 98% 99–100% Dry cough 31 (76%) 47% 29–75% Dyspnoea 22 (55%) 72% 40–42% Diarrhoea 1 (3%) 26% 20–25% Sore throat 0 21% 13–25% Ventilatory support 9·8% 80% 14–20% Data are n, age (range), or n (%) unless otherwise stated. 2019-nCoV=2019 novel coronavirus. MERS-CoV=Middle East respiratory syndrome coronavirus. SARS-CoV=severe acute respiratory syndrome coronavirus. * Demographics and symptoms for 2019-nCoV infection are based on data from the first 41 patients reported by Chaolin Huang and colleagues (admitted before Jan 2, 2020). 8 Case numbers and mortalities are updated up to Jan 21, 2020) as disclosed by the Chinese Health Commission. † Data as of Jan 23, 2020. ‡ Data as of Jan 21, 2020. 9 As an RNA virus, 2019-nCoV still has the inherent feature of a high mutation rate, although like other coronaviruses the mutation rate might be somewhat lower than other RNA viruses because of its genome-encoded exonuclease. This aspect provides the possibility for this newly introduced zoonotic viral pathogen to adapt to become more efficiently transmitted from person to person and possibly become more virulent. Two previous coronavirus outbreaks had been reported in the 21st century. The clinical features of 2019-nCoV, in comparison with SARS-CoV and Middle East respiratory syndrome (MERS)-CoV, are summarised in the table. The ongoing 2019-nCoV outbreak has undoubtedly caused the memories of the SARS-CoV outbreak starting 17 years ago to resurface in many people. In November, 2002, clusters of pneumonia of unknown cause were reported in Guangdong province, China, now known as the SARS-CoV outbreak. The number of cases of SARS increased substantially in the next year in China and later spread globally, 14 infecting at least 8096 people and causing 774 deaths. 12 The international spread of SARS-CoV in 2003 was attributed to its strong transmission ability under specific circumstances and the insufficient preparedness and implementation of infection control practices. Chinese public health and scientific capabilities have been greatly transformed since 2003. An efficient system is ready for monitoring and responding to infectious disease outbreaks and the 2019-nCoV pneumonia has been quickly added to the Notifiable Communicable Disease List and given the highest priority by Chinese health authorities. The increasing number of cases and widening geographical spread of the disease raise grave concerns about the future trajectory of the outbreak, especially with the Chinese Lunar New Year quickly approaching. Under normal circumstances, an estimated 3 billion trips would be made in the Spring Festival travel rush this year, with 15 million trips happening in Wuhan. The virus might further spread to other places during this festival period and cause epidemics, especially if it has acquired the ability to efficiently transmit from person to person. Consequently, the 2019-nCoV outbreak has led to implementation of extraordinary public health measures to reduce further spread of the virus within China and elsewhere. Although WHO has not recommended any international travelling restrictions so far, 15 the local government in Wuhan announced on Jan 23, 2020, the suspension of public transportation, with closure of airports, railway stations, and highways in the city, to prevent further disease transmission. 16 Further efforts in travel restriction might follow. Active surveillance for new cases and close monitoring of their contacts are being implemented. To improve detection efficiency, front-line clinics, apart from local centres for disease control and prevention, should be armed with validated point-of-care diagnostic kits. Rapid information disclosure is a top priority for disease control and prevention. A daily press release system has been established in China to ensure effective and efficient disclosure of epidemic information. Education campaigns should be launched to promote precautions for travellers, including frequent hand-washing, cough etiquette, and use of personal protection equipment (eg, masks) when visiting public places. Also, the general public should be motivated to report fever and other risk factors for coronavirus infection, including travel history to affected area and close contacts with confirmed or suspected cases. Considering that substantial numbers of patients with SARS and MERS were infected in health-care settings, precautions need to be taken to prevent nosocomial spread of the virus. Unfortunately, 16 health-care workers, some of whom were working in the same ward, have been confirmed to be infected with 2019-nCoV to date, although the routes of transmission and the possible role of so-called super-spreaders remain to be clarified. 9 Epidemiological studies need to be done to assess risk factors for infection in health-care personnel and quantify potential subclinical or asymptomatic infections. Notably, the transmission of SARS-CoV was eventually halted by public health measures including elimination of nosocomial infections. We need to be wary of the current outbreak turning into a sustained epidemic or even a pandemic. The availability of the virus' genetic sequence and initial data on the epidemiology and clinical consequences of the 2019-nCoV infections are only the first steps to understanding the threat posed by this pathogen. Many important questions remain unanswered, including its origin, extent, and duration of transmission in humans, ability to infect other animal hosts, and the spectrum and pathogenesis of human infections. Characterising viral isolates from successive generations of human infections will be key to updating diagnostics and assessing viral evolution. Beyond supportive care, 17 no specific coronavirus antivirals or vaccines of proven efficacy in humans exist, although clinical trials of both are ongoing for MERS-CoV and one controlled trial of ritonavir-boosted lopinavir monotherapy has been launched for 2019-nCoV (ChiCTR2000029308). Future animal model and clinical studies should focus on assessing the effectiveness and safety of promising antiviral drugs, monoclonal and polyclonal neutralising antibody products, and therapeutics directed against immunopathologic host responses. We have to be aware of the challenge and concerns brought by 2019-nCoV to our community. Every effort should be given to understand and control the disease, and the time to act is now. This online publication has been corrected. The corrected version first appeared at thelancet.com on January 29, 2020
            Bookmark
            • Record: found
            • Abstract: found
            • Article: found
            Is Open Access

            Substantial undocumented infection facilitates the rapid dissemination of novel coronavirus (SARS-CoV2)

            Estimation of the prevalence and contagiousness of undocumented novel coronavirus (SARS-CoV2) infections is critical for understanding the overall prevalence and pandemic potential of this disease. Here we use observations of reported infection within China, in conjunction with mobility data, a networked dynamic metapopulation model and Bayesian inference, to infer critical epidemiological characteristics associated with SARS-CoV2, including the fraction of undocumented infections and their contagiousness. We estimate 86% of all infections were undocumented (95% CI: [82%–90%]) prior to 23 January 2020 travel restrictions. Per person, the transmission rate of undocumented infections was 55% of documented infections ([46%–62%]), yet, due to their greater numbers, undocumented infections were the infection source for 79% of documented cases. These findings explain the rapid geographic spread of SARS-CoV2 and indicate containment of this virus will be particularly challenging.
              Bookmark
              • Record: found
              • Abstract: found
              • Article: found
              Is Open Access

              The reproductive number of COVID-19 is higher compared to SARS coronavirus

              Introduction In Wuhan, China, a novel and alarmingly contagious primary atypical (viral) pneumonia broke out in December 2019. It has since been identified as a zoonotic coronavirus, similar to SARS coronavirus and MERS coronavirus and named COVID-19. As of 8 February 2020, 33 738 confirmed cases and 811 deaths have been reported in China. Here we review the basic reproduction number (R 0) of the COVID-19 virus. R 0 is an indication of the transmissibility of a virus, representing the average number of new infections generated by an infectious person in a totally naïve population. For R 0 > 1, the number infected is likely to increase, and for R 0 < 1, transmission is likely to die out. The basic reproduction number is a central concept in infectious disease epidemiology, indicating the risk of an infectious agent with respect to epidemic spread. Methods and Results PubMed, bioRxiv and Google Scholar were accessed to search for eligible studies. The term ‘coronavirus & basic reproduction number’ was used. The time period covered was from 1 January 2020 to 7 February 2020. For this time period, we identified 12 studies which estimated the basic reproductive number for COVID-19 from China and overseas. Table 1 shows that the estimates ranged from 1.4 to 6.49, with a mean of 3.28, a median of 2.79 and interquartile range (IQR) of 1.16. Table 1 Published estimates of R 0 for 2019-nCoV Study (study year) Location Study date Methods Approaches R 0 estimates (average) 95% CI Joseph et al. 1 Wuhan 31 December 2019–28 January 2020 Stochastic Markov Chain Monte Carlo methods (MCMC) MCMC methods with Gibbs sampling and non-informative flat prior, using posterior distribution 2.68 2.47–2.86 Shen et al. 2 Hubei province 12–22 January 2020 Mathematical model, dynamic compartmental model with population divided into five compartments: susceptible individuals, asymptomatic individuals during the incubation period, infectious individuals with symptoms, isolated individuals with treatment and recovered individuals R 0 = \documentclass[12pt]{minimal} \usepackage{amsmath} \usepackage{wasysym} \usepackage{amsfonts} \usepackage{amssymb} \usepackage{amsbsy} \usepackage{upgreek} \usepackage{mathrsfs} \setlength{\oddsidemargin}{-69pt} \begin{document} }{}$\beta$\end{document} / \documentclass[12pt]{minimal} \usepackage{amsmath} \usepackage{wasysym} \usepackage{amsfonts} \usepackage{amssymb} \usepackage{amsbsy} \usepackage{upgreek} \usepackage{mathrsfs} \setlength{\oddsidemargin}{-69pt} \begin{document} }{}$\alpha$\end{document} \documentclass[12pt]{minimal} \usepackage{amsmath} \usepackage{wasysym} \usepackage{amsfonts} \usepackage{amssymb} \usepackage{amsbsy} \usepackage{upgreek} \usepackage{mathrsfs} \setlength{\oddsidemargin}{-69pt} \begin{document} }{}$\beta$\end{document} = mean person-to-person transmission rate/day in the absence of control interventions, using nonlinear least squares method to get its point estimate \documentclass[12pt]{minimal} \usepackage{amsmath} \usepackage{wasysym} \usepackage{amsfonts} \usepackage{amssymb} \usepackage{amsbsy} \usepackage{upgreek} \usepackage{mathrsfs} \setlength{\oddsidemargin}{-69pt} \begin{document} }{}$\alpha$\end{document} = isolation rate = 6 6.49 6.31–6.66 Liu et al. 3 China and overseas 23 January 2020 Statistical exponential Growth, using SARS generation time = 8.4 days, SD = 3.8 days Applies Poisson regression to fit the exponential growth rateR 0 = 1/M(−𝑟)M = moment generating function of the generation time distributionr = fitted exponential growth rate 2.90 2.32–3.63 Liu et al. 3 China and overseas 23 January 2020 Statistical maximum likelihood estimation, using SARS generation time = 8.4 days, SD = 3.8 days Maximize log-likelihood to estimate R 0 by using surveillance data during a disease epidemic, and assuming the secondary case is Poisson distribution with expected value R 0 2.92 2.28–3.67 Read et al. 4 China 1–22 January 2020 Mathematical transmission model assuming latent period = 4 days and near to the incubation period Assumes daily time increments with Poisson-distribution and apply a deterministic SEIR metapopulation transmission model, transmission rate = 1.94, infectious period =1.61 days 3.11 2.39–4.13 Majumder et al. 5 Wuhan 8 December 2019 and 26 January 2020 Mathematical Incidence Decay and Exponential Adjustment (IDEA) model Adopted mean serial interval lengths from SARS and MERS ranging from 6 to 10 days to fit the IDEA model, 2.0–3.1 (2.55) / WHO China 18 January 2020 / / 1.4–2.5 (1.95) / Cao et al. 6 China 23 January 2020 Mathematical model including compartments Susceptible-Exposed-Infectious-Recovered-Death-Cumulative (SEIRDC) R = K 2 (L × D) + K(L + D) + 1L = average latent period = 7,D = average latent infectious period = 9,K = logarithmic growth rate of the case counts 4.08 / Zhao et al. 7 China 10–24 January 2020 Statistical exponential growth model method adopting serial interval from SARS (mean = 8.4 days, SD = 3.8 days) and MERS (mean = 7.6 days, SD = 3.4 days) Corresponding to 8-fold increase in the reporting rateR 0 = 1/M(−𝑟)𝑟 =intrinsic growth rateM = moment generating function 2.24 1.96–2.55 Zhao et al. 7 China 10–24 January 2020 Statistical exponential growth model method adopting serial interval from SARS (mean = 8.4 days, SD = 3.8 days) and MERS (mean = 7.6 days, SD = 3.4 days) Corresponding to 2-fold increase in the reporting rateR 0 = 1/M(−𝑟)𝑟 =intrinsic growth rateM = moment generating function 3.58 2.89–4.39 Imai (2020) 8 Wuhan January 18, 2020 Mathematical model, computational modelling of potential epidemic trajectories Assume SARS-like levels of case-to-case variability in the numbers of secondary cases and a SARS-like generation time with 8.4 days, and set number of cases caused by zoonotic exposure and assumed total number of cases to estimate R 0 values for best-case, median and worst-case 1.5–3.5 (2.5) / Julien and Althaus 9 China and overseas 18 January 2020 Stochastic simulations of early outbreak trajectories Stochastic simulations of early outbreak trajectories were performed that are consistent with the epidemiological findings to date 2.2 Tang et al. 10 China 22 January 2020 Mathematical SEIR-type epidemiological model incorporates appropriate compartments corresponding to interventions Method-based method and Likelihood-based method 6.47 5.71–7.23 Qun Li et al. 11 China 22 January 2020 Statistical exponential growth model Mean incubation period = 5.2 days, mean serial interval = 7.5 days 2.2 1.4–3.9 Averaged 3.28 CI, Confidence interval. Figure 1 Timeline of the R 0 estimates for the 2019-nCoV virus in China The first studies initially reported estimates of R 0 with lower values. Estimations subsequently increased and then again returned in the most recent estimates to the levels initially reported (Figure 1). A closer look reveals that the estimation method used played a role. The two studies using stochastic methods to estimate R 0, reported a range of 2.2–2.68 with an average of 2.44. 1 , 9 The six studies using mathematical methods to estimate R 0 produced a range from 1.5 to 6.49, with an average of 4.2. 2 , 4–6 , 8 , 10 The three studies using statistical methods such as exponential growth estimated an R 0 ranging from 2.2 to 3.58, with an average of 2.67. 3 , 7 , 11 Discussion Our review found the average R 0 to be 3.28 and median to be 2.79, which exceed WHO estimates from 1.4 to 2.5. The studies using stochastic and statistical methods for deriving R 0 provide estimates that are reasonably comparable. However, the studies using mathematical methods produce estimates that are, on average, higher. Some of the mathematically derived estimates fall within the range produced the statistical and stochastic estimates. It is important to further assess the reason for the higher R 0 values estimated by some the mathematical studies. For example, modelling assumptions may have played a role. In more recent studies, R 0 seems to have stabilized at around 2–3. R 0 estimations produced at later stages can be expected to be more reliable, as they build upon more case data and include the effect of awareness and intervention. It is worthy to note that the WHO point estimates are consistently below all published estimates, although the higher end of the WHO range includes the lower end of the estimates reviewed here. R 0 estimates for SARS have been reported to range between 2 and 5, which is within the range of the mean R 0 for COVID-19 found in this review. Due to similarities of both pathogen and region of exposure, this is expected. On the other hand, despite the heightened public awareness and impressively strong interventional response, the COVID-19 is already more widespread than SARS, indicating it may be more transmissible. Conclusions This review found that the estimated mean R 0 for COVID-19 is around 3.28, with a median of 2.79 and IQR of 1.16, which is considerably higher than the WHO estimate at 1.95. These estimates of R 0 depend on the estimation method used as well as the validity of the underlying assumptions. Due to insufficient data and short onset time, current estimates of R 0 for COVID-19 are possibly biased. However, as more data are accumulated, estimation error can be expected to decrease and a clearer picture should form. Based on these considerations, R 0 for COVID-19 is expected to be around 2–3, which is broadly consistent with the WHO estimate. Author contributions J.R. and A.W.S. had the idea, and Y.L. did the literature search and created the table and figure. Y.L. and A.W.S. wrote the first draft; A.A.G. drafted the final manuscript. All authors contributed to the final manuscript. Conflict of interest None declared.
                Bookmark

                Author and article information

                Contributors
                Journal
                Commun Nonlinear Sci Numer Simul
                Commun Nonlinear Sci Numer Simul
                Communications in Nonlinear Science & Numerical Simulation
                Elsevier B.V.
                1007-5704
                1878-7274
                30 April 2020
                30 April 2020
                : 105303
                Affiliations
                [0001]MOMAT Research Group Interdisciplinary Mathematics Institute Complutense University of Madrid Spain
                Author notes
                [* ]Corresponding author. Tel.: +34913944530, Fax: +34913944530. angel@ 123456mat.ucm.es
                Article
                S1007-5704(20)30135-0 105303
                10.1016/j.cnsns.2020.105303
                7190554
                32355435
                12c103ec-b5ce-48cb-b233-dbf54c23af65
                © 2020 Elsevier B.V. All rights reserved.

                Since January 2020 Elsevier has created a COVID-19 resource centre with free information in English and Mandarin on the novel coronavirus COVID-19. The COVID-19 resource centre is hosted on Elsevier Connect, the company's public news and information website. Elsevier hereby grants permission to make all its COVID-19-related research that is available on the COVID-19 resource centre - including this research content - immediately available in PubMed Central and other publicly funded repositories, such as the WHO COVID database with rights for unrestricted research re-use and analyses in any form or by any means with acknowledgement of the original source. These permissions are granted for free by Elsevier for as long as the COVID-19 resource centre remains active.

                History
                : 2 April 2020
                : 13 April 2020
                : 21 April 2020
                Categories
                Article

                mathematical model,θ-seihrd model,covid-19,coronavirus,sars-cov-2,pandemic,numerical simulation,parameter estimation

                Comments

                Comment on this article