29
views
0
recommends
+1 Recommend
0 collections
    0
    shares
      • Record: found
      • Abstract: found
      • Article: found
      Is Open Access

      Different genomic relationship matrices for single-step analysis using phenotypic, pedigree and genomic information

      research-article
      1 , , 2 , 3 , 3
      Genetics, Selection, Evolution : GSE
      BioMed Central

      Read this article at

      Bookmark
          There is no author summary for this article yet. Authors can add summaries to their articles on ScienceOpen to make them more accessible to a non-specialist audience.

          Abstract

          Background

          The incorporation of genomic coefficients into the numerator relationship matrix allows estimation of breeding values using all phenotypic, pedigree and genomic information simultaneously. In such a single-step procedure, genomic and pedigree-based relationships have to be compatible. As there are many options to create genomic relationships, there is a question of which is optimal and what the effects of deviations from optimality are.

          Methods

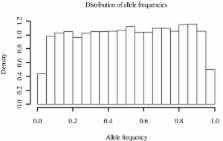
          Data of litter size (total number born per litter) for 338,346 sows were analyzed. Illumina PorcineSNP60 BeadChip genotypes were available for 1,989. Analyses were carried out with the complete data set and with a subset of genotyped animals and three generations pedigree (5,090 animals). A single-trait animal model was used to estimate variance components and breeding values. Genomic relationship matrices were constructed using allele frequencies equal to 0.5 ( G05), equal to the average minor allele frequency ( GMF), or equal to observed frequencies ( GOF). A genomic matrix considering random ascertainment of allele frequencies was also used ( GOF*). A normalized matrix ( GN) was obtained to have average diagonal coefficients equal to 1. The genomic matrices were combined with the numerator relationship matrix creating H matrices.

          Results

          In G05 and GMF, both diagonal and off-diagonal elements were on average greater than the pedigree-based coefficients. In GOF and GOF*, the average diagonal elements were smaller than pedigree-based coefficients. The mean of off-diagonal coefficients was zero in GOF and GOF*. Choices of G with average diagonal coefficients different from 1 led to greater estimates of additive variance in the smaller data set. The correlation between EBV and genomic EBV (n = 1,989) were: 0.79 using G05, 0.79 using GMF, 0.78 using GOF, 0.79 using GOF*, and 0.78 using GN. Accuracies calculated by inversion increased with all genomic matrices. The accuracies of genomic-assisted EBV were inflated in all cases except when GN was used.

          Conclusions

          Parameter estimates may be biased if the genomic relationship coefficients are in a different scale than pedigree-based coefficients. A reasonable scaling may be obtained by using observed allele frequencies and re-scaling the genomic relationship matrix to obtain average diagonal elements of 1.

          Related collections

          Most cited references8

          • Record: found
          • Abstract: found
          • Article: not found

          Hot topic: a unified approach to utilize phenotypic, full pedigree, and genomic information for genetic evaluation of Holstein final score.

          The first national single-step, full-information (phenotype, pedigree, and marker genotype) genetic evaluation was developed for final score of US Holsteins. Data included final scores recorded from 1955 to 2009 for 6,232,548 Holsteins cows. BovineSNP50 (Illumina, San Diego, CA) genotypes from the Cooperative Dairy DNA Repository (Beltsville, MD) were available for 6,508 bulls. Three analyses used a repeatability animal model as currently used for the national US evaluation. The first 2 analyses used final scores recorded up to 2004. The first analysis used only a pedigree-based relationship matrix. The second analysis used a relationship matrix based on both pedigree and genomic information (single-step approach). The third analysis used the complete data set and only the pedigree-based relationship matrix. The fourth analysis used predictions from the first analysis (final scores up to 2004 and only a pedigree-based relationship matrix) and prediction using a genomic based matrix to obtain genetic evaluation (multiple-step approach). Different allele frequencies were tested in construction of the genomic relationship matrix. Coefficients of determination between predictions of young bulls from parent average, single-step, and multiple-step approaches and their 2009 daughter deviations were 0.24, 0.37 to 0.41, and 0.40, respectively. The highest coefficient of determination for a single-step approach was observed when using a genomic relationship matrix with assumed allele frequencies of 0.5. Coefficients for regression of 2009 daughter deviations on parent-average, single-step, and multiple-step predictions were 0.76, 0.68 to 0.79, and 0.86, respectively, which indicated some inflation of predictions. The single-step regression coefficient could be increased up to 0.92 by scaling differences between the genomic and pedigree-based relationship matrices with little loss in accuracy of prediction. One complete evaluation took about 2h of computing time and 2.7 gigabytes of memory. Computing times for single-step analyses were slightly longer (2%) than for pedigree-based analysis. A national single-step genetic evaluation with the pedigree relationship matrix augmented with genomic information provided genomic predictions with accuracy and bias comparable to multiple-step procedures and could account for any population or data structure. Advantages of single-step evaluations should increase in the future when animals are pre-selected on genotypes. Copyright 2010 American Dairy Science Association. Published by Elsevier Inc. All rights reserved.
            Bookmark
            • Record: found
            • Abstract: found
            • Article: not found

            Increased accuracy of artificial selection by using the realized relationship matrix.

            Dense marker genotypes allow the construction of the realized relationship matrix between individuals, with elements the realized proportion of the genome that is identical by descent (IBD) between pairs of individuals. In this paper, we demonstrate that by replacing the average relationship matrix derived from pedigree with the realized relationship matrix in best linear unbiased prediction (BLUP) of breeding values, the accuracy of the breeding values can be substantially increased, especially for individuals with no phenotype of their own. We further demonstrate that this method of predicting breeding values is exactly equivalent to the genomic selection methodology where the effects of quantitative trait loci (QTLs) contributing to variation in the trait are assumed to be normally distributed. The accuracy of breeding values predicted using the realized relationship matrix in the BLUP equations can be deterministically predicted for known family relationships, for example half sibs. The deterministic method uses the effective number of independently segregating loci controlling the phenotype that depends on the type of family relationship and the length of the genome. The accuracy of predicted breeding values depends on this number of effective loci, the family relationship and the number of phenotypic records. The deterministic prediction demonstrates that the accuracy of breeding values can approach unity if enough relatives are genotyped and phenotyped. For example, when 1000 full sibs per family were genotyped and phenotyped, and the heritability of the trait was 0.5, the reliability of predicted genomic breeding values (GEBVs) for individuals in the same full sib family without phenotypes was 0.82. These results were verified by simulation. A deterministic prediction was also derived for random mating populations, where the effective population size is the key parameter determining the effective number of independently segregating loci. If the effective population size is large, a very large number of individuals must be genotyped and phenotyped in order to accurately predict breeding values for unphenotyped individuals from the same population. If the heritability of the trait is 0.3, and N(e)=100, approximately 12474 individuals with genotypes and phenotypes are required in order to predict GEBVs of un-phenotyped individuals in the same population with an accuracy of 0.7 [corrected].
              Bookmark
              • Record: found
              • Abstract: found
              • Article: found

              Additive genetic variability and the Bayesian alphabet.

              The use of all available molecular markers in statistical models for prediction of quantitative traits has led to what could be termed a genomic-assisted selection paradigm in animal and plant breeding. This article provides a critical review of some theoretical and statistical concepts in the context of genomic-assisted genetic evaluation of animals and crops. First, relationships between the (Bayesian) variance of marker effects in some regression models and additive genetic variance are examined under standard assumptions. Second, the connection between marker genotypes and resemblance between relatives is explored, and linkages between a marker-based model and the infinitesimal model are reviewed. Third, issues associated with the use of Bayesian models for marker-assisted selection, with a focus on the role of the priors, are examined from a theoretical angle. The sensitivity of a Bayesian specification that has been proposed (called "Bayes A") with respect to priors is illustrated with a simulation. Methods that can solve potential shortcomings of some of these Bayesian regression procedures are discussed briefly.
                Bookmark

                Author and article information

                Journal
                Genet Sel Evol
                Genetics, Selection, Evolution : GSE
                BioMed Central
                0999-193X
                1297-9686
                2011
                5 January 2011
                : 43
                : 1
                : 1
                Affiliations
                [1 ]Genus Plc, Hendersonville, TN, USA
                [2 ]Instituto Nacional de Investigación Agropecuaria, Las Brujas, Uruguay
                [3 ]Department of Animal and Dairy Science, University of Georgia, Athens, GA, USA
                Article
                1297-9686-43-1
                10.1186/1297-9686-43-1
                3022661
                21208445
                2a6c417c-d647-4ba8-8c56-cf01f7172913
                Copyright ©2011 Forni et al; licensee BioMed Central Ltd.

                This is an Open Access article distributed under the terms of the Creative Commons Attribution License (<url>http://creativecommons.org/licenses/by/2.0</url>), which permits unrestricted use, distribution, and reproduction in any medium, provided the original work is properly cited.

                History
                : 3 June 2010
                : 5 January 2011
                Categories
                Research

                Genetics
                Genetics

                Comments

                Comment on this article